
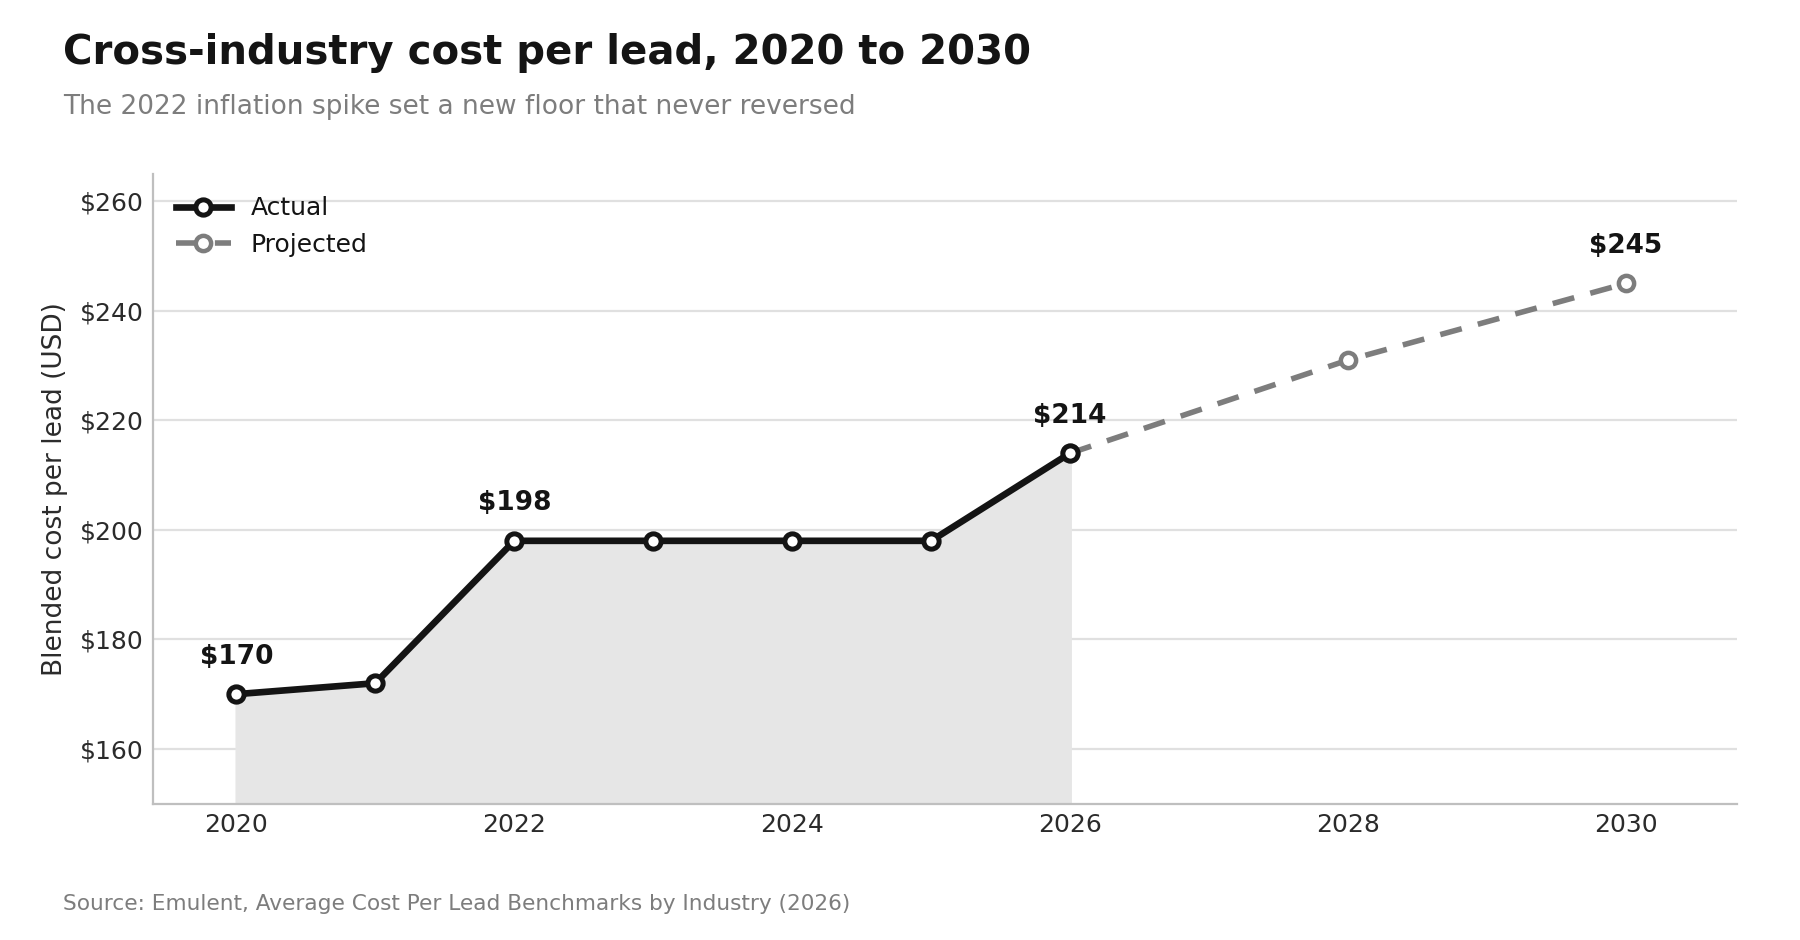
The blended cross-industry cost per lead reached roughly $214 in 2026, up from $198 in 2025 and $170 in 2020, with no reversal in sight (source: Emulent).
Growth Centr builds acquisition programs for B2B and SaaS teams that are judged on pipeline economics, not lead volume, which means benchmark data is where most of our engagements begin.
Cost per lead is the most quoted and least understood metric in demand generation, because the same number can signal healthy efficiency in one vertical and a broken funnel in another.
This report breaks down average cost per lead by industry, by channel, by company size, and by paid versus organic split, then shows you how to convert those benchmarks into a target CPL your own unit economics can actually support.
Key Takeaways
- Blended CPL spans $91 in ecommerce to $982 in higher education.
- Cross-industry average sits near $214 in 2026, drifting upward each year.
- Organic CPL runs 40 to 60% below paid in every measured sector.
- Channel choice moves CPL more than industry: referrals $25, trade shows $840.
- Google Ads CPL fell for the first time in five years, to $66.69.
The State of Lead Generation Spend in 2026
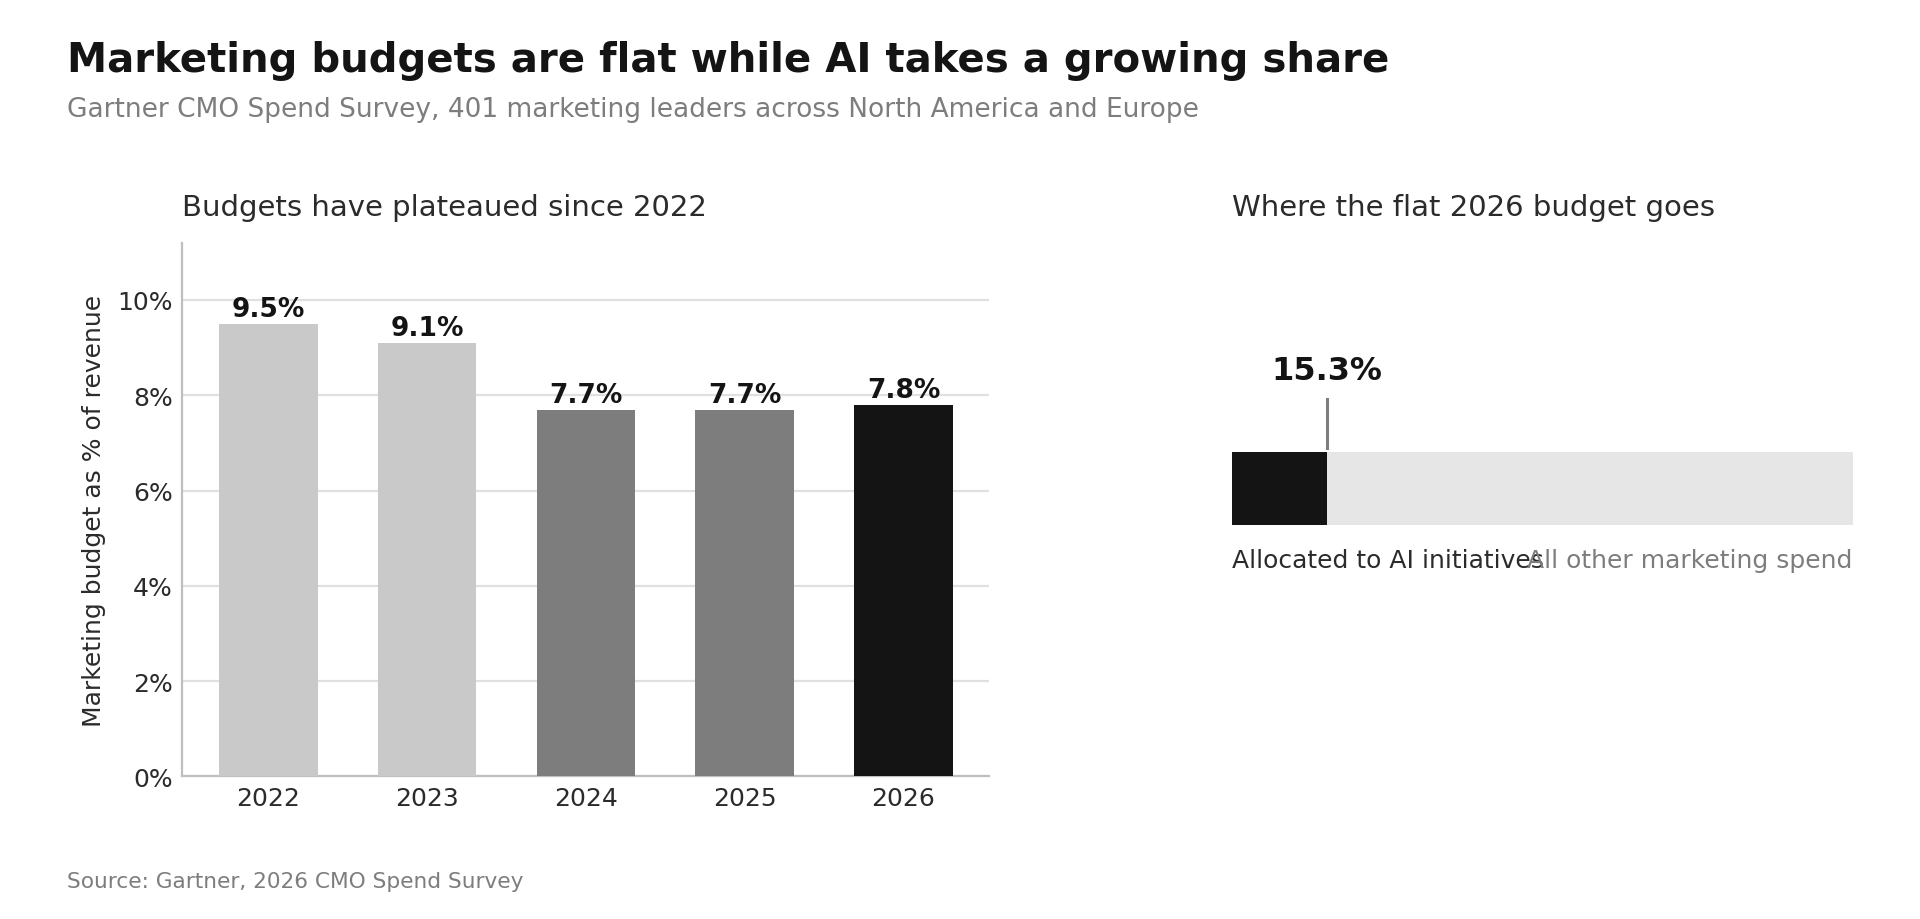
Budgets are not growing, but lead costs are. Marketing budgets sat at 7.8% of company revenue in 2026, up marginally from 7.7% the prior year and roughly 18% below where they were four years earlier (source: Gartner).
The same survey found CMOs allocating 15.3% of marketing budgets to AI initiatives, money that has to come from somewhere inside a flat envelope.
That squeeze is why CPL benchmarking has become a board-level exercise rather than a channel manager's spreadsheet. When the budget cannot expand, the only levers left are lead cost and conversion rate.
For a wider view of how spend is distributed across sectors, see this breakdown of the average marketing budget by industry and this analysis of where CMO budgets are going in 2026.
What Cost Per Lead Actually Measures
Cost per lead is total marketing spend for a channel or campaign divided by the number of new leads that channel produced. It sits upstream of customer acquisition cost, which also carries sales expense and only counts closed customers.
The metric has one structural weakness: the word "lead" has no fixed definition. A form fill on a blog post and an appointment-ready prospect from cold outbound both count.
That definitional gap explains most of the disagreement between published benchmark tables.
Search ad form fills average under $70, while agencies measuring appointment-ready outbound leads report figures near $770 across 17 industries, with cybersecurity campaigns running $750 to $1,500 (source: LeadSpot).
Before benchmarking, fix your own definition.
Our guide to MQL vs SQL covers where most teams draw that line, and this piece on killing the MQL covers what replaced it at companies that abandoned the model entirely.
Average Cost Per Lead by Industry in 2026
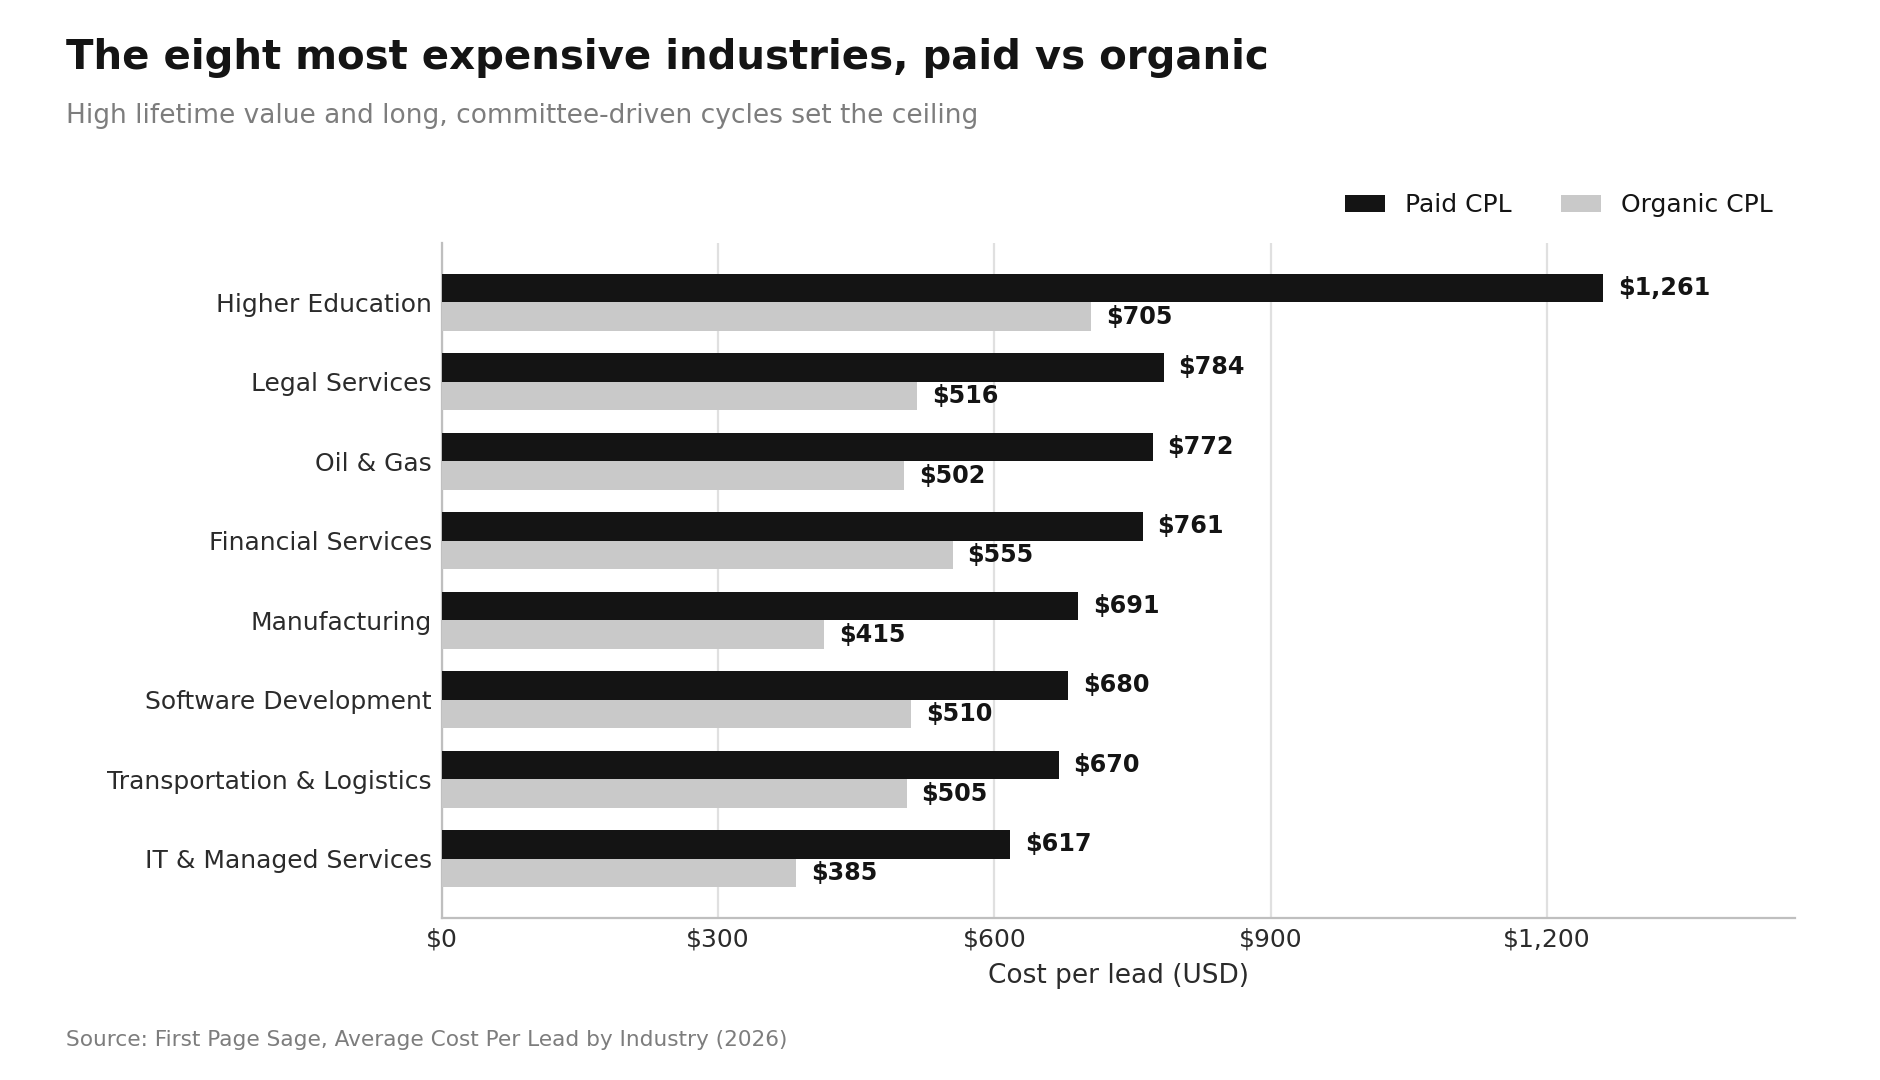
The table below shows blended CPL alongside the paid and organic split across 30 industries (source: First Page Sage).
| Industry | Paid CPL | Organic CPL | Blended CPL |
|---|---|---|---|
| Higher Education | $1,261 | $705 | $982 |
| Financial Services | $761 | $555 | $653 |
| Legal Services | $784 | $516 | $649 |
| Oil & Gas | $772 | $502 | $637 |
| Software Development | $680 | $510 | $591 |
| Transportation & Logistics | $670 | $505 | $588 |
| Manufacturing | $691 | $415 | $553 |
| IT & Managed Services | $617 | $385 | $503 |
| Industrial IoT | $590 | $404 | $497 |
| Staffing & Recruiting | $476 | $518 | $497 |
| Fintech | $490 | $413 | $452 |
| Real Estate | $480 | $416 | $448 |
| Business Insurance | $460 | $388 | $424 |
| Cybersecurity | $411 | $404 | $406 |
| PCB Design & Manufacturing | $480 | $271 | $376 |
| Aerospace & Aviation | $469 | $277 | $373 |
| Healthcare | $401 | $320 | $361 |
| Addiction Treatment | $380 | $213 | $297 |
| Engineering | $371 | $201 | $287 |
| Automotive | $295 | $271 | $283 |
| Environmental Services | $346 | $207 | $278 |
| Hotels & Resorts | $308 | $224 | $266 |
| Biotech | $274 | $236 | $255 |
| B2B SaaS | $310 | $164 | $237 |
| Construction | $280 | $174 | $227 |
| Solar | $217 | $196 | $206 |
| Pharmaceutical | $124 | $135 | $131 |
| Entertainment | $116 | $111 | $114 |
| HVAC | $115 | $69 | $92 |
| eCommerce | $98 | $83 | $91 |
The spread from top to bottom is roughly 11x, the widest it has ever been.
Why the Expensive Industries Cost So Much
Three structural factors explain almost every row above: lifetime value, sales cycle length, and auction density.
- Higher education tops the list because a single enrolled student can carry $50,000 or more in tuition revenue across a multi-year commitment.
- Financial services and legal firms operate in markets where one converted client justifies hundreds of dollars in acquisition spend, so bids rise until the marginal lead stops being profitable.
- Manufacturing, logistics, and industrial IoT carry long, committee-driven cycles where the same account requires many touches before it produces a qualified conversation.
Regulation adds a fourth factor.
- Healthcare practices face HIPAA constraints that limit targeting precision and push CPL above comparable consumer verticals. Pharmaceutical sits low at $131 largely because its lead definition is looser and much of its demand arrives through channels not priced by auction.
Why the Cheap Industries Stay Cheap
Ecommerce ($91) and HVAC ($92) anchor the bottom of the table. Both operate on short buying cycles, broad addressable markets, and channels that scale on volume rather than precision. Their margins would not tolerate anything higher.
The important read is that a low CPL is not a virtue in itself. An ecommerce brand paying $91 per lead with a $60 average order value has a worse business than a legal firm paying $649 for a case worth $25,000. CPL only becomes meaningful next to close rate and deal size.
Paid vs Organic Cost Per Lead
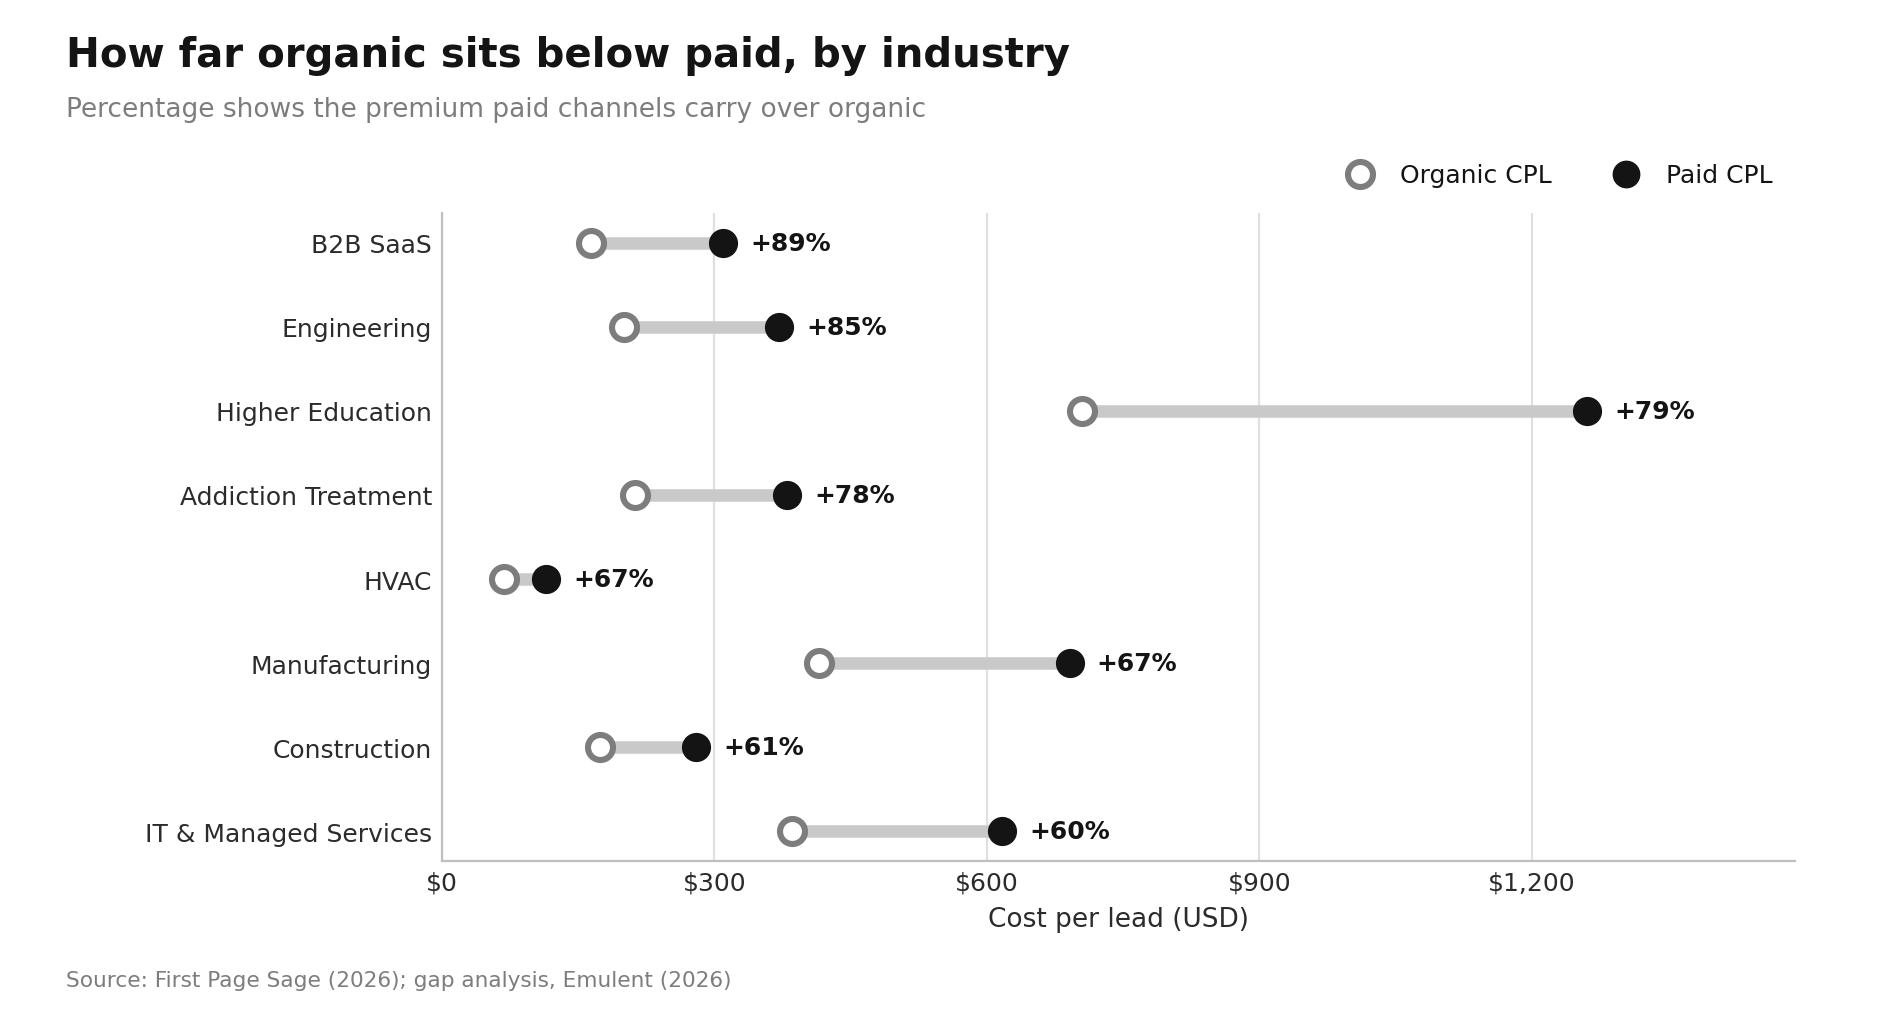
Across every industry in the dataset, organic CPL runs 40 to 60% below paid. In B2B SaaS the gap widens to 89% ($310 paid against $164 organic). In higher education it stretches to 156% (source: Emulent).
The temptation is to read this as proof that paid is wasteful. The more useful framing is that paid and organic are different financial instruments. Paid produces volume on day one and inflates with auction competition.
Organic compounds but takes six to twelve months of sustained content investment before it produces leads at scale.
Teams running a 90-day pipeline target cannot wait for organic to mature, so they pay the paid premium. Teams with established content programs watch their blended CPL fall quietly each year as organic share grows. Both are correct decisions at different stages.
Our overview of demand generation covers how to sequence the two.
Cost Per Lead by Channel
Channel mix moves your blended number more than your industry does. A trade show lead averages $840. A referral averages $25. That is a 34x spread inside a single B2B budget (source: Emulent).
Expensive channels are not automatically bad investments.
Trade shows and LinkedIn buy access to buying-committee members who are hard to reach any other way, and the math works when deal sizes exceed $50,000.
The failure mode is running those channels at scale for transactional deals.
On LinkedIn specifically, Lead Gen Forms typically deliver $75 to $150 per lead, against roughly $25 to $60 on Meta, but LinkedIn was the only major paid channel delivering positive return on ad spend at 121% ROAS versus 67% for Google Search and 51% for Meta (source: Dreamdata via Meet-Lea).
The same analysis found the average B2B journey runs 281 days from first ad impression to revenue, which means short-window CPL reporting systematically understates the channel.
More context sits in our LinkedIn marketing statistics.
Cost Per Lead on Paid Search by Industry
Search advertising gets its own benchmark set because the lead definition is narrower and the sample is large.
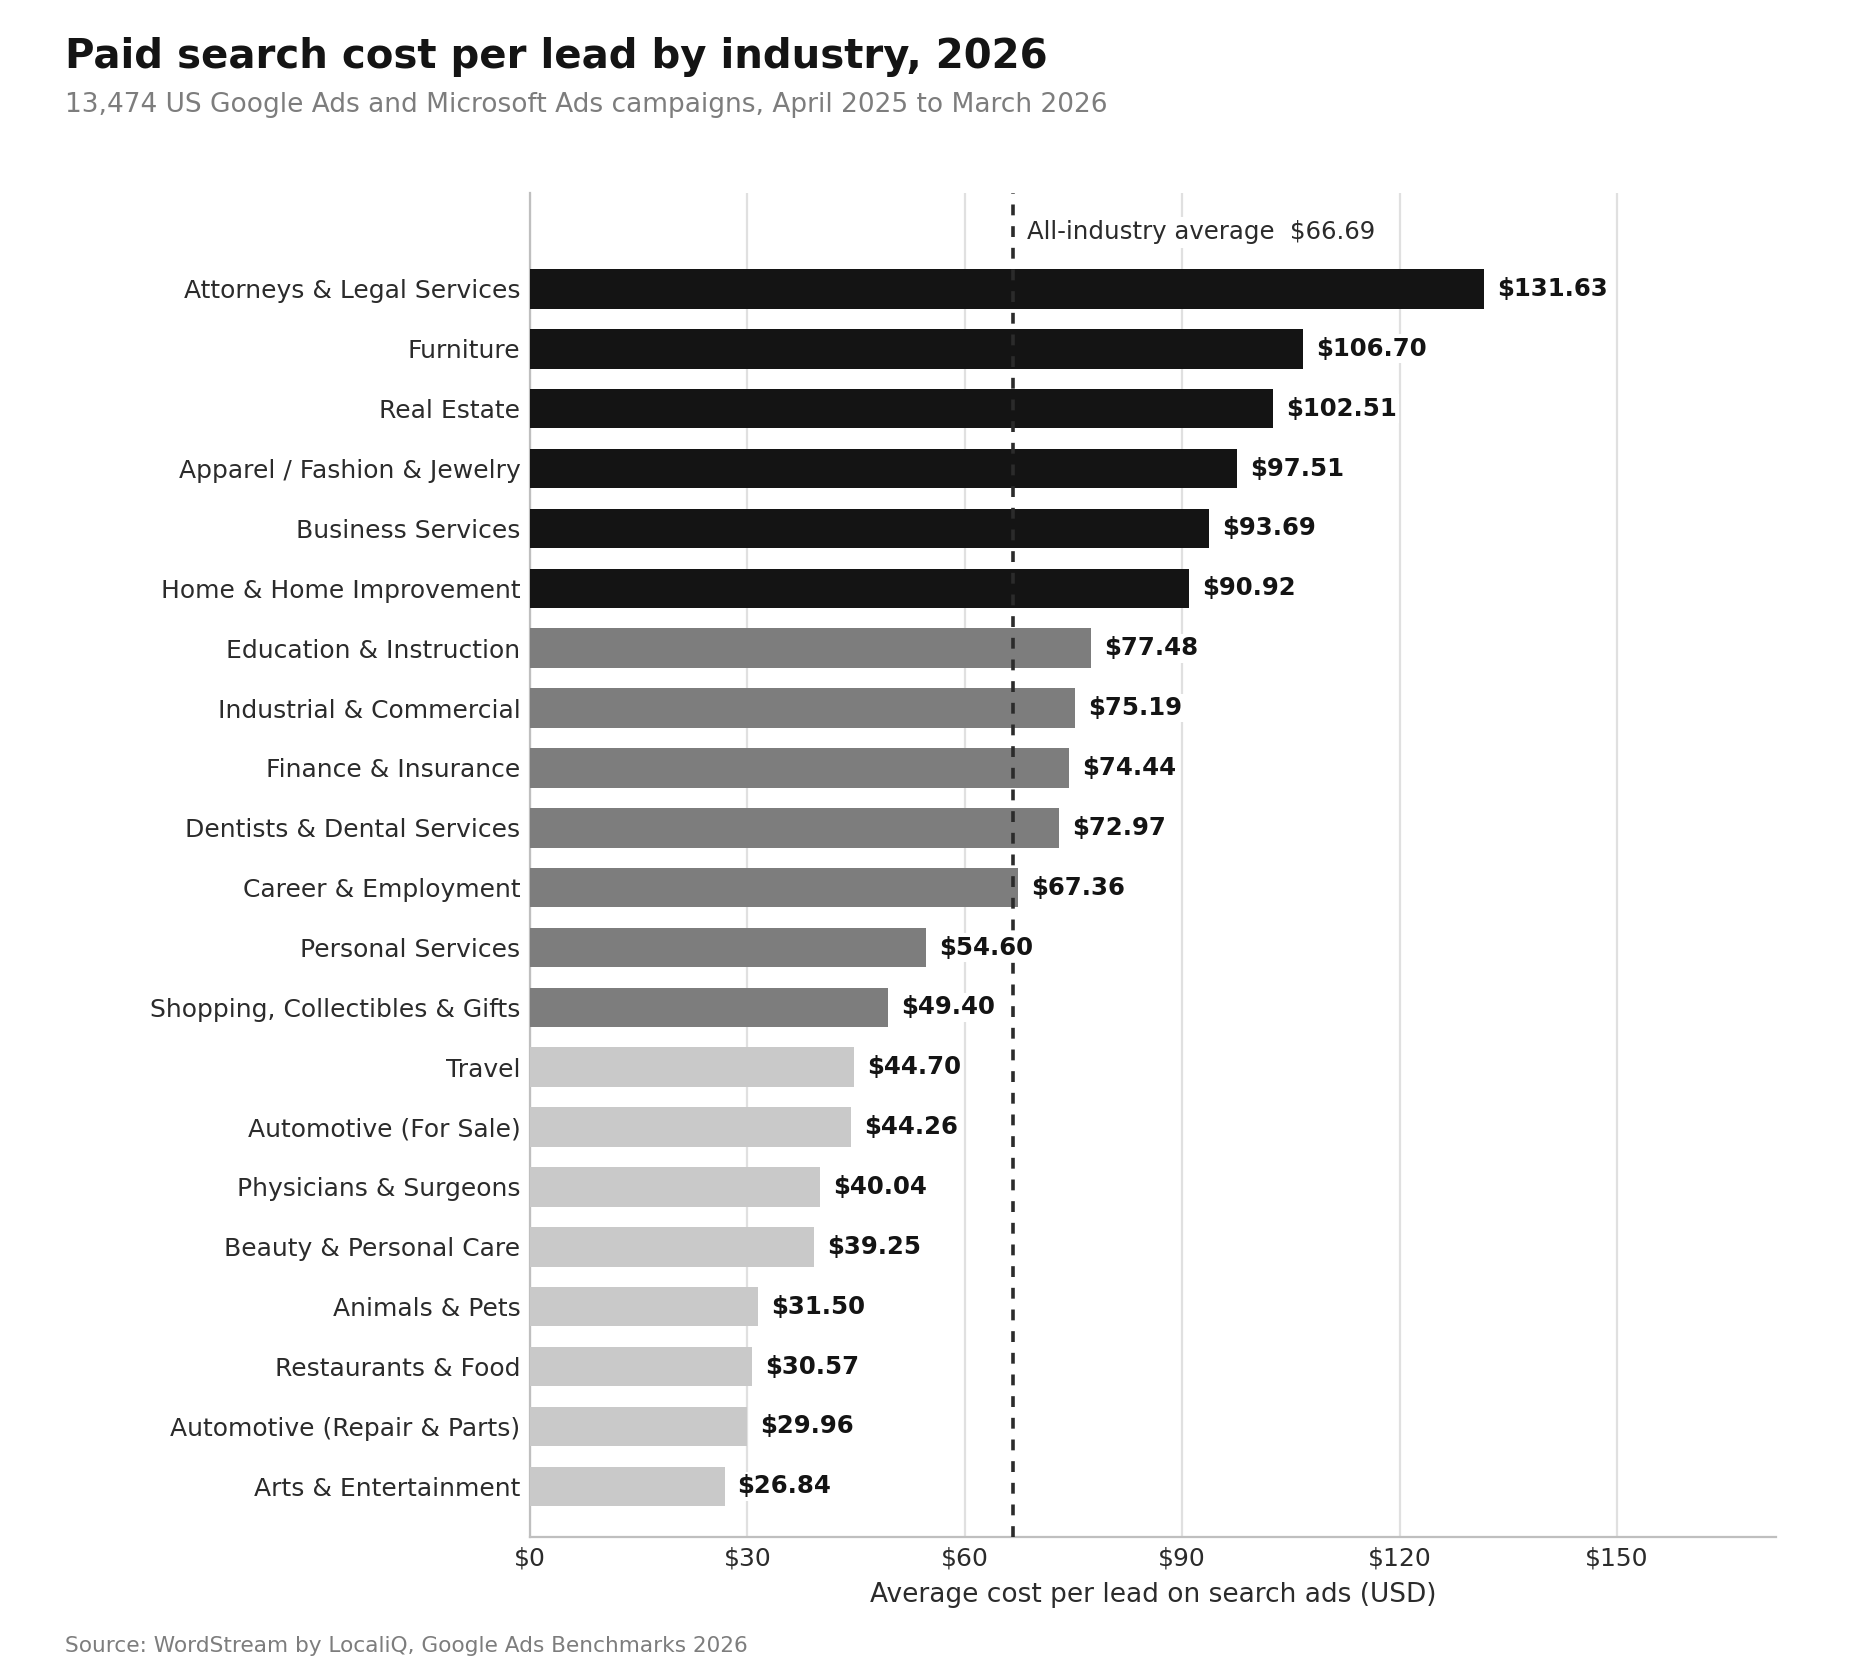
Across 13,474 US campaigns running April 2025 through March 2026, the average search ads CPL was $66.69, alongside a $5.42 CPC, a 6.64% CTR, and an 8.18% conversion rate (source: WordStream).
| Business category | Average CPL |
|---|---|
| Attorneys & Legal Services | $131.63 |
| Furniture | $106.70 |
| Real Estate | $102.51 |
| Apparel / Fashion & Jewelry | $97.51 |
| Business Services | $93.69 |
| Home & Home Improvement | $90.92 |
| Education & Instruction | $77.48 |
| Industrial & Commercial | $75.19 |
| Finance & Insurance | $74.44 |
| Dentists & Dental Services | $72.97 |
| Career & Employment | $67.36 |
| Personal Services | $54.60 |
| Shopping, Collectibles & Gifts | $49.40 |
| Travel | $44.70 |
| Automotive (For Sale) | $44.26 |
| Physicians & Surgeons | $40.04 |
| Beauty & Personal Care | $39.25 |
| Animals & Pets | $31.50 |
| Restaurants & Food | $30.57 |
| Automotive (Repair & Parts) | $29.96 |
| Arts & Entertainment | $26.84 |
The headline finding was that search CPL declined for the first time in five years, driven not by cheaper clicks but by better closing: conversion rates improved in 87% of industries.
Travel fell 39.35%, beauty and personal care fell 34.95%, and physicians and surgeons fell 29.54%. The industries that saw increases aligned with tariff exposure, including automotive and retail.
Additional platform-level detail sits in our Google Ads statistics for 2026 and this breakdown of Google Ads CPC in 2026.
How Company Size Changes the Number
Enterprise teams pay roughly 3x what small businesses pay per lead, and the reason is structural rather than a matter of waste (source: Emulent).
An enterprise SaaS company chasing $250,000 contracts competes for senior buyers who sit through several vendor demos a week. Reaching them requires sharper creative, more touches, and channels with higher floor prices.
A small business selling locally needs none of that infrastructure. Both can be running efficiently and still report CPLs that differ by a factor of three.
Projections put a 7 to 9% annual drift on enterprise CPL against 4 to 6% for small business, because enterprise channel pricing is stickier upward while smaller teams benefit disproportionately from AI-assisted creative production and self-serve channels.
From Cost Per Lead to Cost Per Customer
CPL on its own predicts nothing. The number that predicts pipeline economics is cost per opportunity, which is CPL divided by your lead-to-opportunity conversion rate.
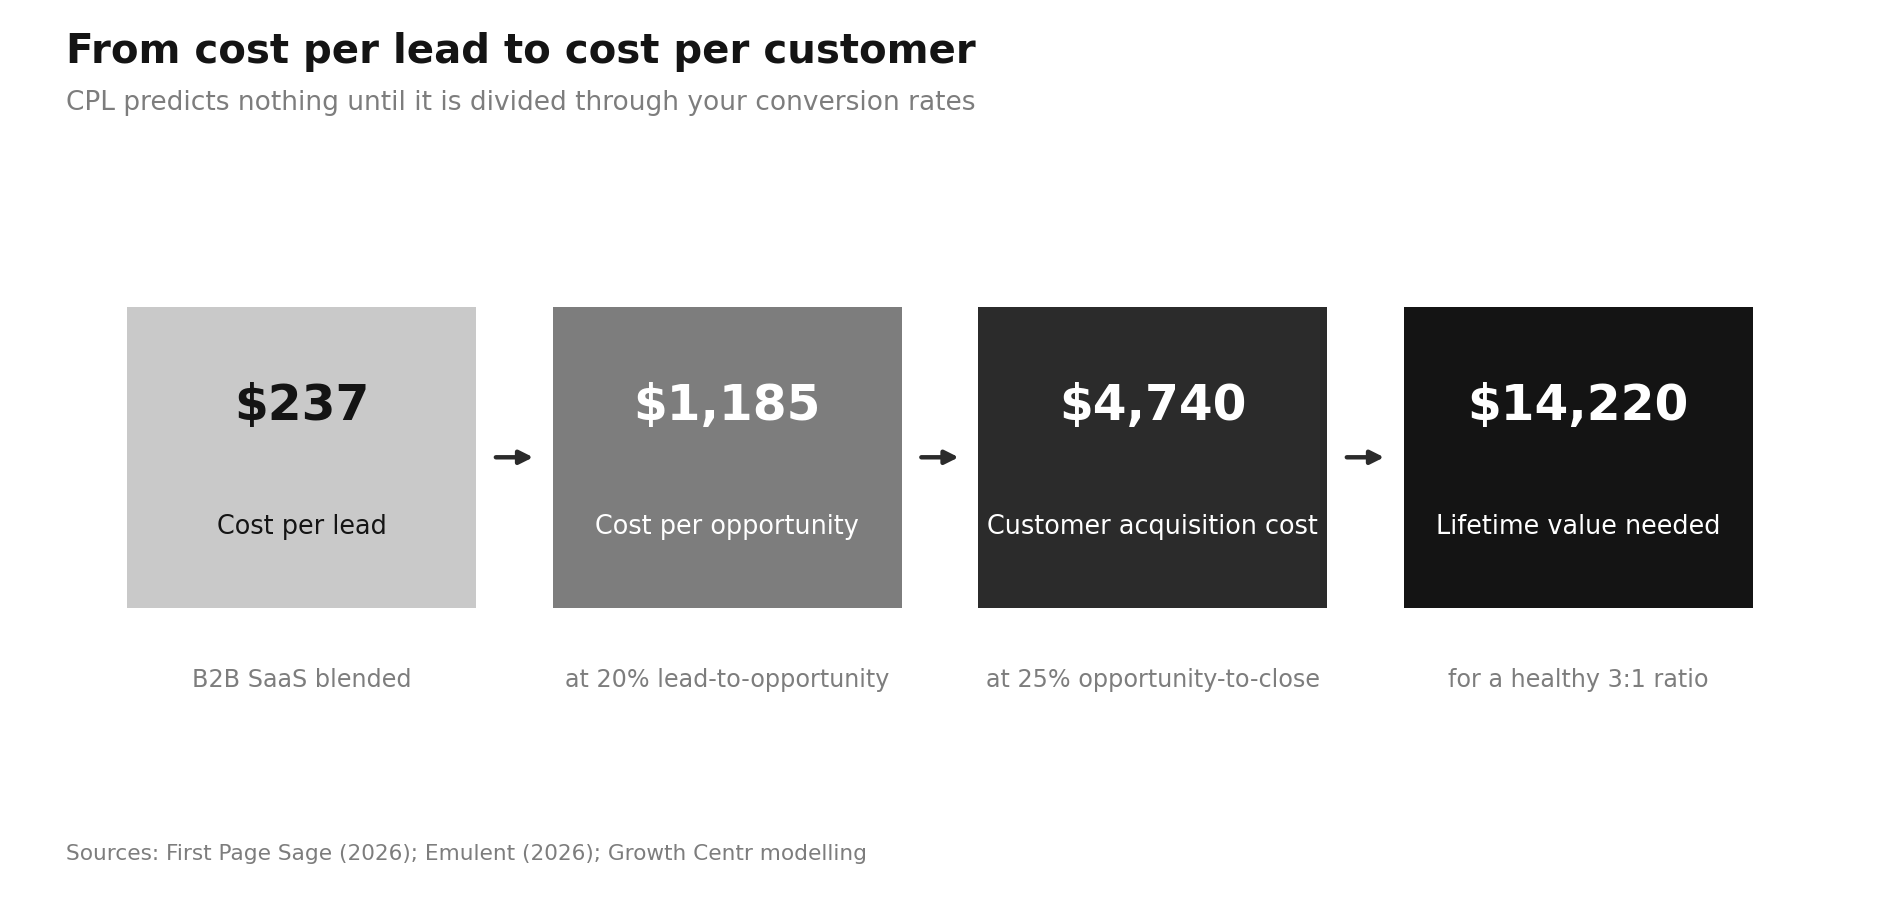
Work through a B2B SaaS example using the blended $237 figure. At a 20% lead-to-opportunity rate, cost per opportunity is $1,185. At a 25% opportunity-to-close rate, customer acquisition cost lands near $4,740 before sales compensation.
Against a $15,000 lifetime value, that is a 3:1 ratio and a healthy business. Against a $6,000 lifetime value, it is not.
This is why a $300 lead converting at 20% beats a $50 lead converting at 2% in every quarter it has been measured.
For the downstream math, see our B2B SaaS CAC benchmarks, our primer on customer lifetime value, and this guide to CAC payback in B2B SaaS.
How to Set Your Own Target CPL
Benchmarks tell you where the market is. They do not tell you what your number should be. Four steps produce a defensible target:
- Start with lifetime value. Use revenue, adjusted for gross margin if cost to serve is significant.
- Divide by your target LTV-to-CAC ratio. A 3:1 ratio is the standard healthy benchmark, giving you a maximum allowable CAC.
- Apply your lead-to-customer conversion rate. If 1 in 10 qualified leads closes, maximum CPL is maximum CAC multiplied by 0.10.
- Pressure-test against your trailing twelve-month close rate, not your aspirational one. Modeling a 25% close rate when the real figure is 12% is the most common error in this exercise.
A correctly calculated target usually lands between your industry's paid average and its organic average. Above that zone means your mix is too paid-heavy for your economics. Below it usually means your lead definition is too loose.
What Is Driving CPL Through 2028
US inflation cooled from 8.0% in 2022 to 2.4% by early 2026, but CPL never followed it down. Ad auction prices are sticky upward: once advertisers accept a higher cost-per-click floor, it becomes the new baseline, and there is no precedent in the available datasets for a meaningful reversal.
Projections put the blended cross-industry average between $240 and $250 by 2030, with growth decelerating each year as AI-assisted lead scoring, programmatic creative, and better conversion-rate optimization absorb an estimated 30 to 40% of paid-channel inflation by 2028 (source: Emulent).
Teams that hold their current channel mix steady will overspend by 15 to 20% within three years without changing anything else.
How to Lower CPL Without Losing Volume
Three moves account for most of the improvement we see in practice.
- Reallocate 10 to 15% of paid budget toward referrals, SEO, email, and webinars. That shift typically reduces blended CPL by 25 to 30% without cutting total lead volume, though it requires the sustained inputs those channels demand.
- Fix conversion rate before touching bids. CPL is cost per click divided by conversion rate, which means a landing page improvement lowers CPL without any change to media spend.
Our overview of conversion rate optimization and these landing page conversion rate benchmarks are the starting points.
- Tighten your lead definition and feed closed-won data back into bidding. Tracking lead volume alone without knowing which leads became customers means the bidding algorithm optimizes toward the wrong outcome.
Our marketing ROI statistics and lead generation statistics cover the measurement side.
Conclusion
Growth Centr works with B2B and SaaS teams that need their lead economics to survive a CFO review, not just a marketing dashboard.
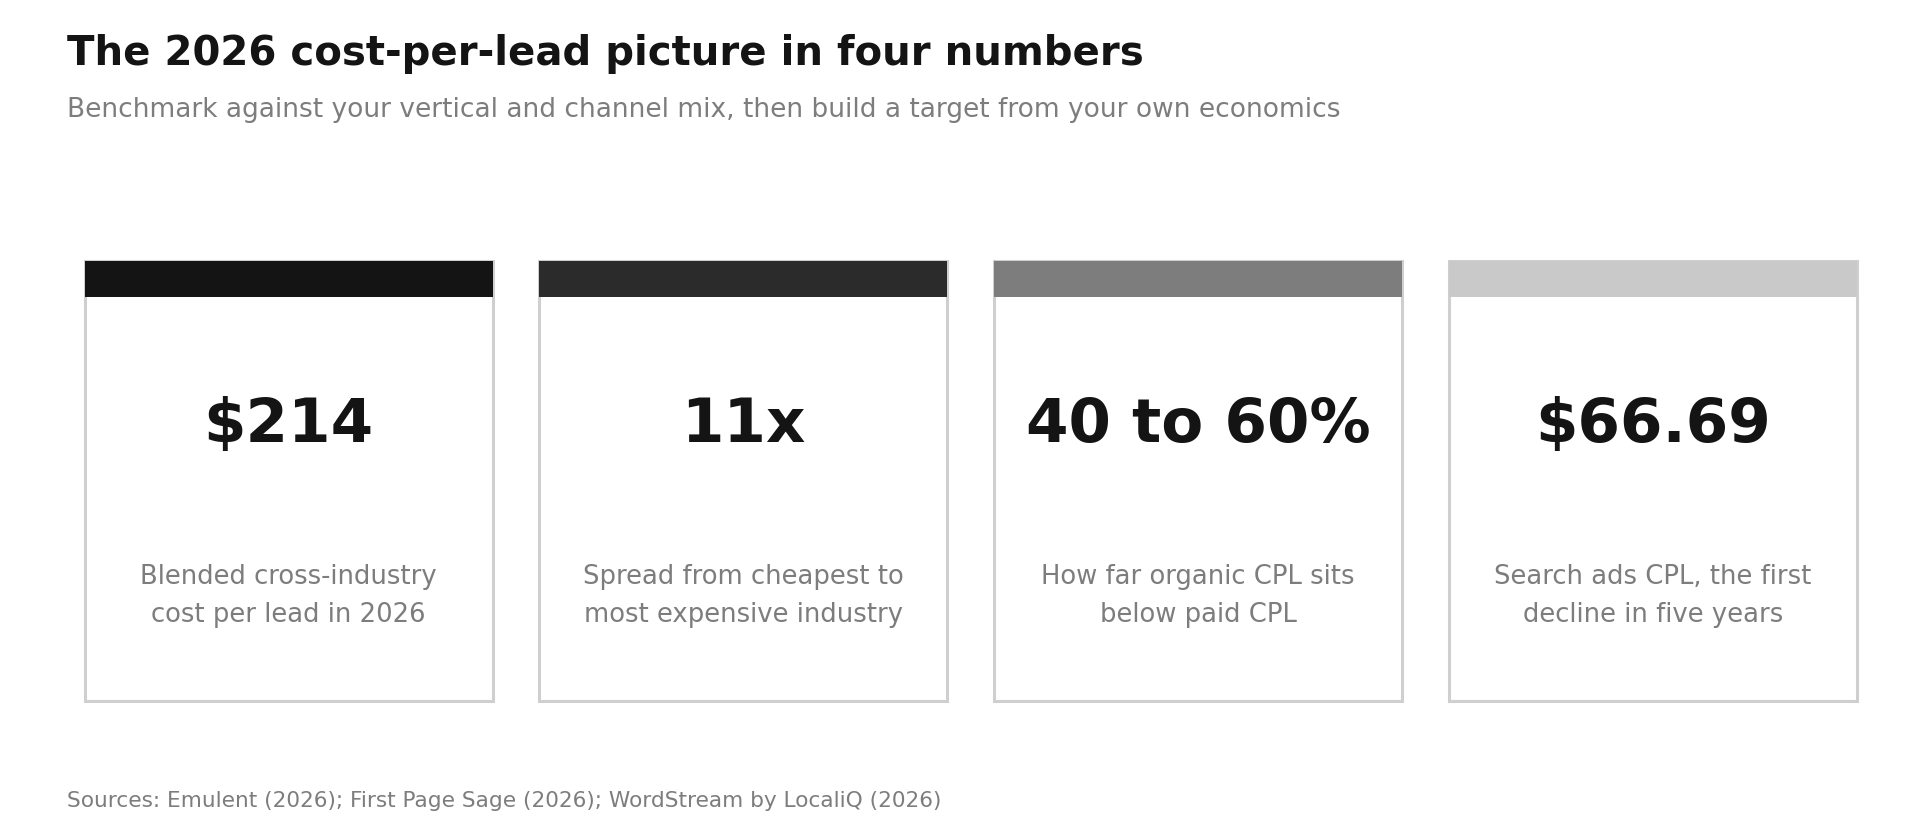
The 2026 data shows a market where blended CPL has settled near $214 and continues drifting upward, where the gap between the cheapest and most expensive industries has stretched to 11x, and where channel mix and paid-organic balance move your number more than your vertical does.
Search advertising delivered a rare piece of good news with the first CPL decline in five years, driven by conversion rate improvements rather than cheaper inventory.
The teams that will hold their cost per lead flat through 2028 are the ones treating these benchmarks as a starting reference and then building a target from their own lifetime value, close rate, and margin.
Read Next
- What Is the SaaS Magic Number?
- LinkedIn Marketing Statistics
- How the EU AI Act Changes AI Protection Requirements for Enterprises
FAQs
1. What is the average cost per lead by industry in 2026?
The average cost per lead by industry in 2026 ranges from roughly $91 in ecommerce to $982 in higher education, with a blended cross-industry average near $214. Most B2B sectors fall between $200 and $700 depending on deal size and sales cycle length.
2. Which industry has the highest cost per lead?
The industry with the highest cost per lead is higher education, at $982 blended, $1,261 on paid channels and $705 on organic. Financial services ($653) and legal services ($649) follow, all driven by high lifetime value per converted customer.
3. What is a good cost per lead for B2B SaaS in 2026?
A good cost per lead for B2B SaaS in 2026 is around $237 blended, which splits into $310 on paid channels and $164 on organic. Anything materially above $310 suggests a paid-heavy mix that your unit economics may not support.
4. How much cheaper is organic cost per lead than paid?
Organic cost per lead is 40 to 60% cheaper than paid across every measured industry, widening to 89% in B2B SaaS and 156% in higher education. The tradeoff is time: organic typically needs six to twelve months to scale to meaningful volume.
5. How do you calculate your target cost per lead?
You calculate your target cost per lead by dividing customer lifetime value by your target LTV-to-CAC ratio, then multiplying the result by your lead-to-customer conversion rate. Use your trailing twelve-month close rate rather than an aspirational one.
Disclaimer:
This content is provided for informational purposes only and does not constitute legal, financial, or compliance advice. Protocol versions, governance arrangements, and partner counts cited here reflect publicly announced milestones as of August 2026 and are moving quickly. Adoption figures come from vendor and foundation announcements with differing methodologies and should be treated as directional signals rather than guaranteed outcomes.