
Last updated: September 30, 2026
LinkedIn revenue grew 12% year over year in the quarter ended June 30, 2026, with growth reported across every line of business (Source: Microsoft).
GrowthCentr builds B2B growth programs on verified benchmark data rather than platform marketing claims, which is why GrowthCentr tracks LinkedIn quarter by quarter instead of citing numbers that went stale two years ago.
LinkedIn has moved from a resume database into the single largest paid and organic channel in B2B, absorbing budget that used to sit in search and trade media.
This report breaks down what the platform costs, what it returns, how audiences behave, and where the 2026 numbers diverge from the ones most teams are still planning against.
Key Takeaways
- LinkedIn revenue rose 12% in the quarter ending June 2026, with Marketing Solutions up 16%.
- Average LinkedIn CPC sits near $6.50, with CPL running from $68 to $200 by vertical.
- LinkedIn now captures roughly 41% of total B2B ad budgets.
- Native documents lead organic engagement at about 7.00%.
- LinkedIn Ads specialists earn $72,000 to $88,000 at mid-level.
What Changed in the September 2026 Update
What Changed on September 30, 2026
This pass adds LinkedIn's AI hiring adoption numbers from the same fiscal Q4 highlights, and tightens the stats cluster with GrowthCentr's Google Ads and PPC comparison posts.
- Recruiters at more than 20,000 companies now use LinkedIn's AI-powered hiring solutions, and seats across LinkedIn's enterprise AI-powered hiring products increased 140% quarter over quarter.
GrowthCentr's take: a 140% quarter-over-quarter jump in AI hiring seats is a demand signal for the rest of the LinkedIn stack. When Talent Solutions buyers adopt AI seat packs that fast, Marketing Solutions auction pressure usually follows in the next budget cycle. Pair this report with GrowthCentr's marketing ROI statistics, Google Ads statistics 2026, and the Google Ads vs LinkedIn Ads vs Microsoft Ads comparison when Finance asks whether LinkedIn still earns its share of paid.
This refresh adds LinkedIn's own fiscal-year results and its 2026 B2B marketing research, and replaces a cross-industry cost-per-lead average with better-sourced vertical ranges.
- LinkedIn revenue increased 12% year over year in the quarter ended June 30, 2026, taking full-year revenue to $19.8 billion, and global membership grew at a double-digit rate for the fifth consecutive year (Source: LinkedIn).
- LinkedIn Marketing Solutions revenue grew 16% year over year, its seventh consecutive quarter of double-digit growth (Source: LinkedIn).
- Time spent on content grew 10% year over year, knowledge-oriented posts rose 24%, and time spent reading comments rose 18% (Source: LinkedIn).
- In LinkedIn's 2026 Global B2B Marketing Outlook (YouGov, 1,299 B2B marketers in five countries), 81% of B2B CMOs said video accelerates sales cycles and 79% said it accelerates lead conversion (Source: LinkedIn).
- Among B2B marketers who work with creators, 82% called influencer campaigns essential to measurable ROI, and 56% of B2B buyers who use creators rely on them in the final stage of buying (Source: LinkedIn).
GrowthCentr's take: a 16% growth rate in Marketing Solutions against 12% for LinkedIn overall means advertiser demand is still outrunning the rest of the business. Expect auction pressure to persist into 2027 budgets, and plan creator and video tests before raising bids. For the finance side of that argument, see GrowthCentr's marketing ROI statistics.
LinkedIn's Scale in 2026: The Baseline Numbers
For lead-volume context beyond LinkedIn alone, see GrowthCentr's lead generation statistics and marketing ROI statistics.
Every planning conversation starts with reach, and LinkedIn's headline number is large enough to be misleading if used alone.
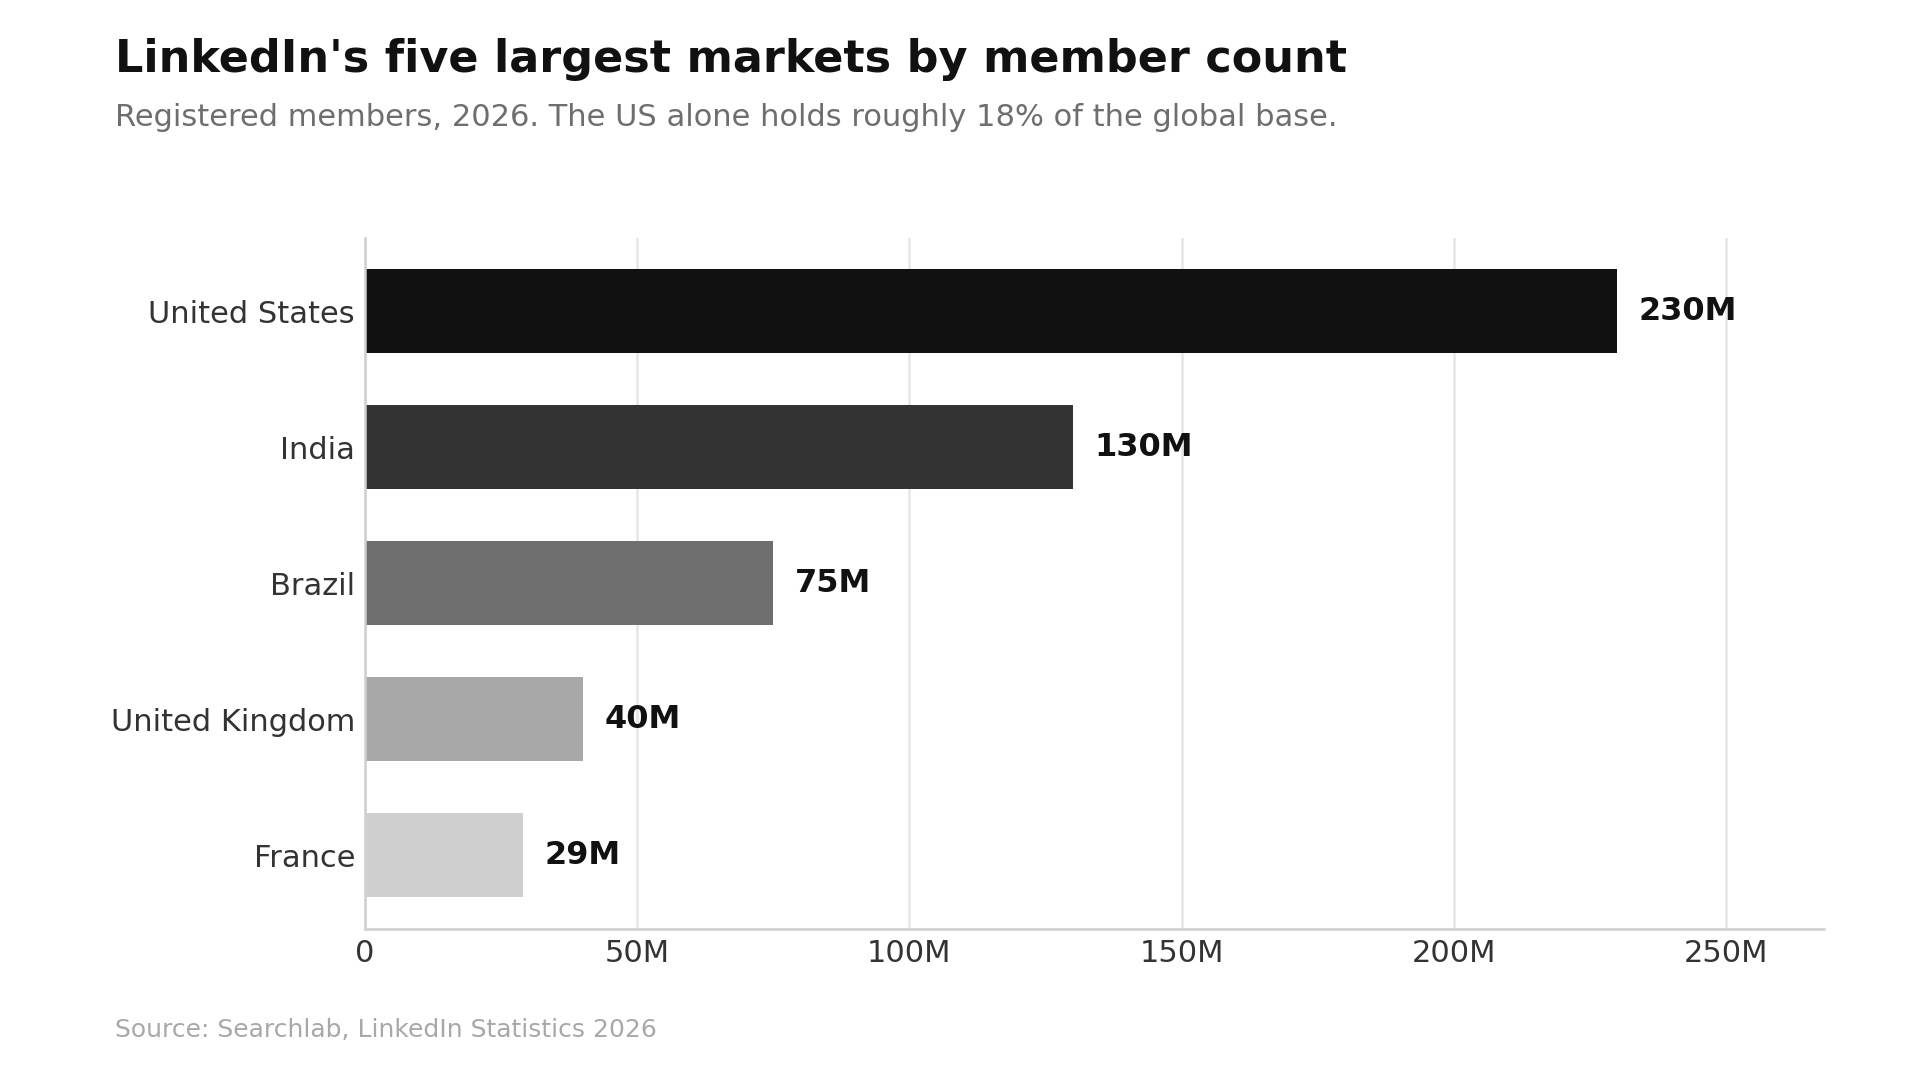
The platform passed 1.3 billion registered members, a milestone Microsoft confirmed on its earnings calls, with the company noting nearly 1.3 billion members as of October (Source: GeekWire).
Registered members are not an addressable audience. Monthly active users sit closer to 310 million, roughly a quarter of the registered base, which is the figure that should anchor frequency and reach modeling (Source: Axis Intelligence).
The Revenue Picture: Why LinkedIn Keeps Raising Prices
LinkedIn crossed $5 billion in quarterly revenue for the first time in the December 2025 quarter, putting the business on an annual run rate above $20 billion, with growth driven by LinkedIn Marketing Solutions rather than recruiting (Source: GeekWire).
Revenue reached $4.832 billion in the quarter ended March 31, 2026, up 12% year over year (Source: Staffing Industry Analysts).
On the advertising side specifically, LinkedIn's B2B ad revenues reached $4.59 billion in 2025, growing 9.0% year over year, and social media now accounts for nearly half of all B2B digital ad spending (Source: EMARKETER).
The AI side of the business is scaling quickly.
Agentic products inside LinkedIn Talent Solutions passed a $450 million annualized run rate, a figure Microsoft's CEO disclosed on the Q3 FY2026 earnings call (Source: Staffing Industry Analysts).
For advertisers, the practical read is simple. Demand is growing faster than inventory, and auction prices reflect that.
Audience Composition: Who You Actually Reach
LinkedIn's targeting premium rests on audience quality, and the demographic data supports the claim.
Roughly 33% of LinkedIn users fall in the 25 to 34 bracket, with 18 to 24 the second largest group at over 20%, and male users making up 56.8% of the base (Source: Sprout Social).
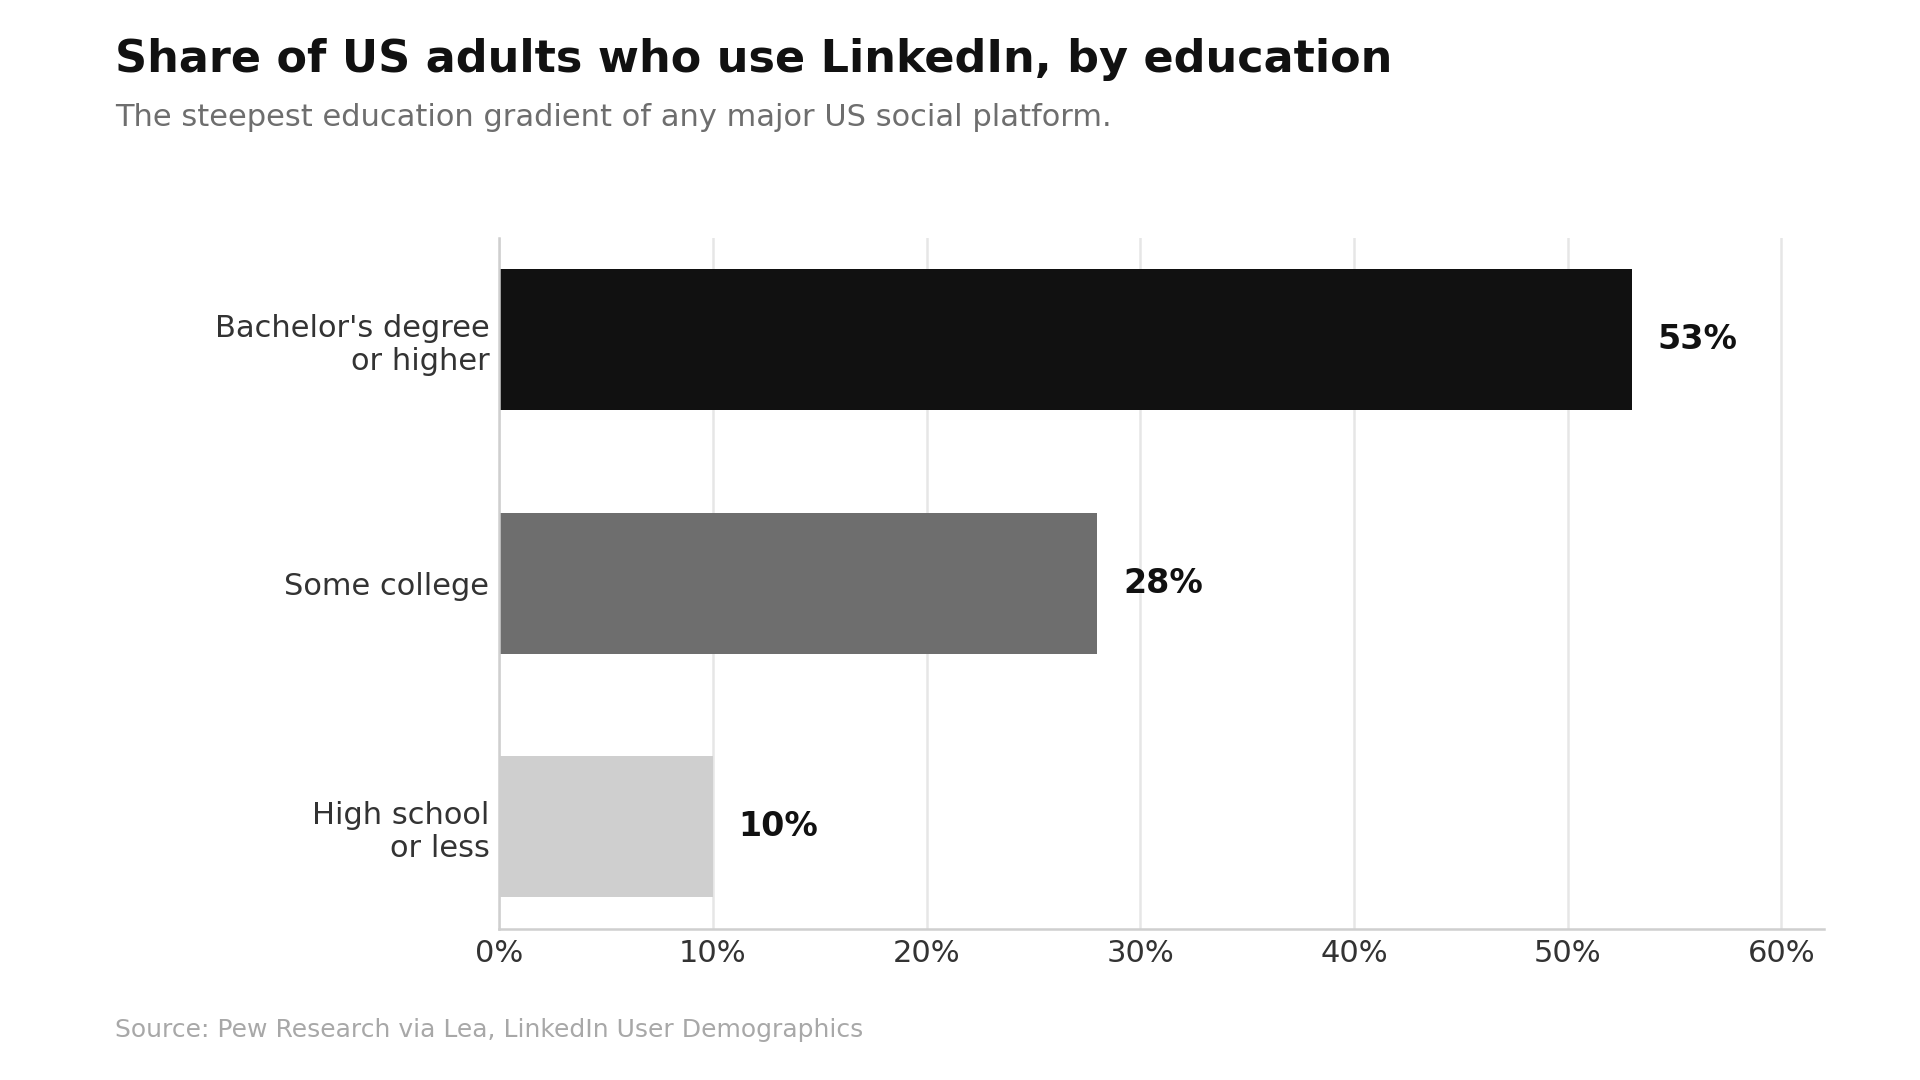
Education skews sharply. Pew data shows 53% of US adults with a bachelor's degree or higher use LinkedIn, compared with 28% of those with some college and 10% of those with a high school education or less (Source: Lea).
Over 61 million US LinkedIn users are senior-level influencers, and 100% of Fortune 500 companies maintain a presence (Source: Charle).
LinkedIn's own marketing claim is that four out of five members drive business decisions at their organizations (Source: ConnectSafely). Treat that as directional, but the underlying pattern holds.
For teams building account-based marketing programs, no other social platform concentrates buying authority this densely.
B2B Marketer Adoption: The Channel Nobody Skips
Adoption figures vary by survey methodology, but the direction is consistent across every source.
Statista data puts LinkedIn usage at 87% of B2B marketers, making it the most used platform in the category (Source: Sprout Social).
Reported satisfaction is unusually high for a paid channel.
Around 86% of B2B marketers use LinkedIn, 93% specifically for content marketing, and 70% report positive ROI, the highest of any social channel (Source: Posterly).
Budget share confirms the sentiment. Dreamdata's attribution data shows LinkedIn now capturing 41% of total B2B ad budgets, up two points year over year, while non-branded search fell from 37% to 33% (Source: Lea).
That reallocation is the single most important budget trend in B2B media right now, and it mirrors what GrowthCentr sees in demand generation planning cycles.
Organic Engagement Benchmarks by Format
Organic performance on LinkedIn separates sharply by format, and the gaps are large enough to change content roadmaps.
Socialinsider's analysis of 1.3 million business posts across 16,645 pages puts the platform-wide engagement rate at 5.20%, an 8% year over year increase (Source: Socialinsider).
Native documents lead all formats at 7.00% average engagement, up 14% year over year, ahead of multi-image posts at 6.45% and video at 6.00% (Source: Lea).
Engagement grew across every format, with text posts up 12%, images up 9%, and video up 7% (Source: Socialinsider).
Video deserves a caveat. Paid video ads on LinkedIn grew 30% year over year (Source: GeekWire), yet organic video views declined 36% year over year across every page size according to Socialinsider benchmark data (Source: Neal Schaffer).
Paid video demand is rising while organic video supply has outpaced attention.
- Reach behaves predictably. Company pages typically reach 2% to 6% of followers organically, with strong posts hitting 8% to 12% and weak ones landing at 1% to 2% (Source: ContentIn).
- Engagement rates also fall as accounts grow. Pages with 1,000 to 10,000 followers typically see 3% to 5%, while pages above 100,000 followers often drop to 0.5% to 1.5% (Source: InfluenceFlow).
The strategic case for building this owned audience is covered well in this analysis of why LinkedIn now functions like search infrastructure.
LinkedIn Ads Benchmarks: CPC, CPM, CTR, and CPL
This is where most planning arguments happen, so the numbers deserve precision.
- Cost per click. Average LinkedIn CPC reached $6.50 in 2026, up 8% from $6.02 in 2025, with industry ranges spanning $4.10 to $15.20 (Source: Ryze AI). Seniority drives most of the variance.
C-suite targeting runs $10 to $24 or more per click, two to three times Director level and six to twelve times individual contributor targeting at $2 to $4 (Source: Foundry CRO).
- Cost per mille. Median CPM sits at $31, with broad B2B targeting in the $20 to $38 range, narrow enterprise targeting at $38 to $65, and ultra-narrow segments reaching $65 to $120 (Source: The Smarketers).
- Click-through rate. Sponsored content typically returns 0.5% to 1.2%, with anything above 1.5% considered strong and below 0.3% signaling a creative or audience problem (Source: The Smarketers).
Document ads run 1.2% to 2.5%. Thought Leader Ads are the standout, posting a 2.68% CTR at a $2.29 CPC, which is 77% cheaper per click than single image ads (Source: Foundry CRO).
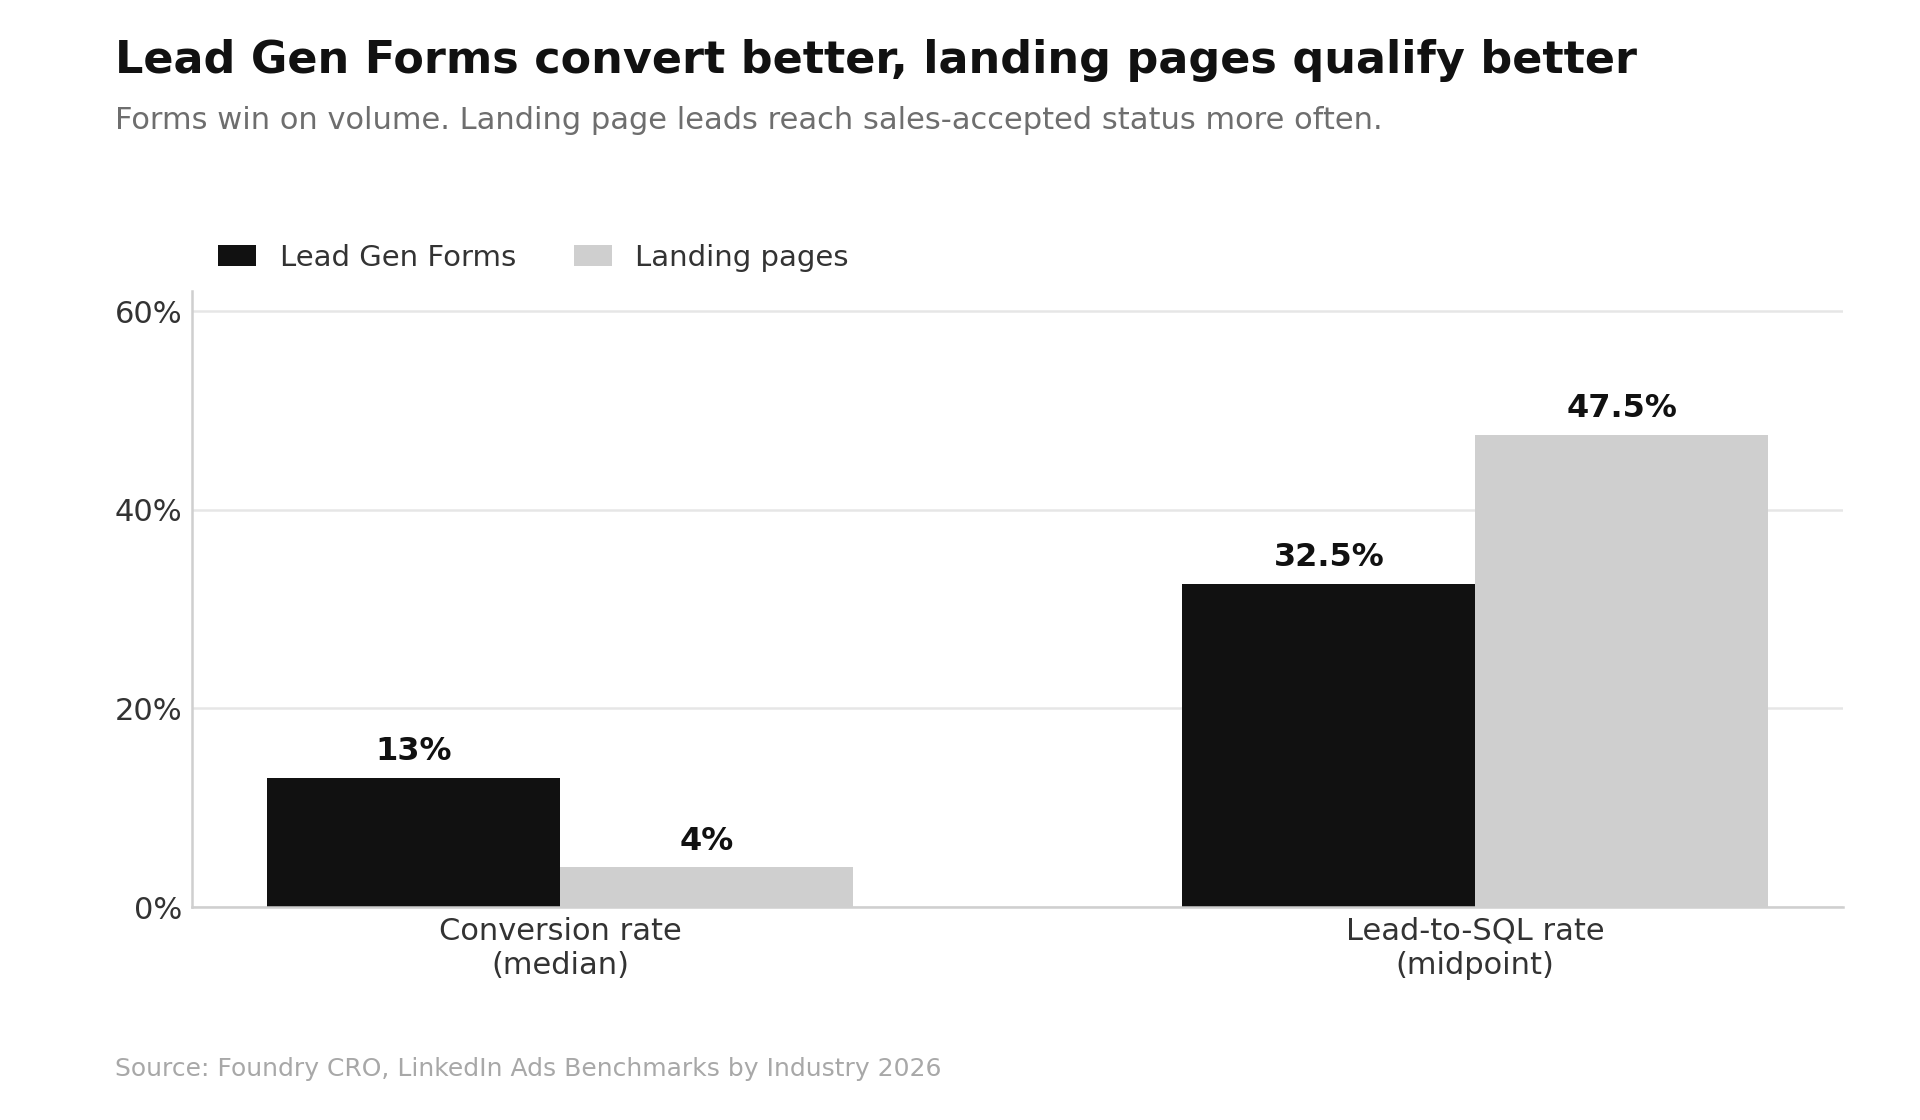
Conversion rate. Lead Gen Forms convert at 10% to 18% with a median of 13%, versus 2% to 6% for landing pages, though landing page leads convert to SQL at 40% to 55% against 25% to 40% for form leads (Source: Foundry CRO).
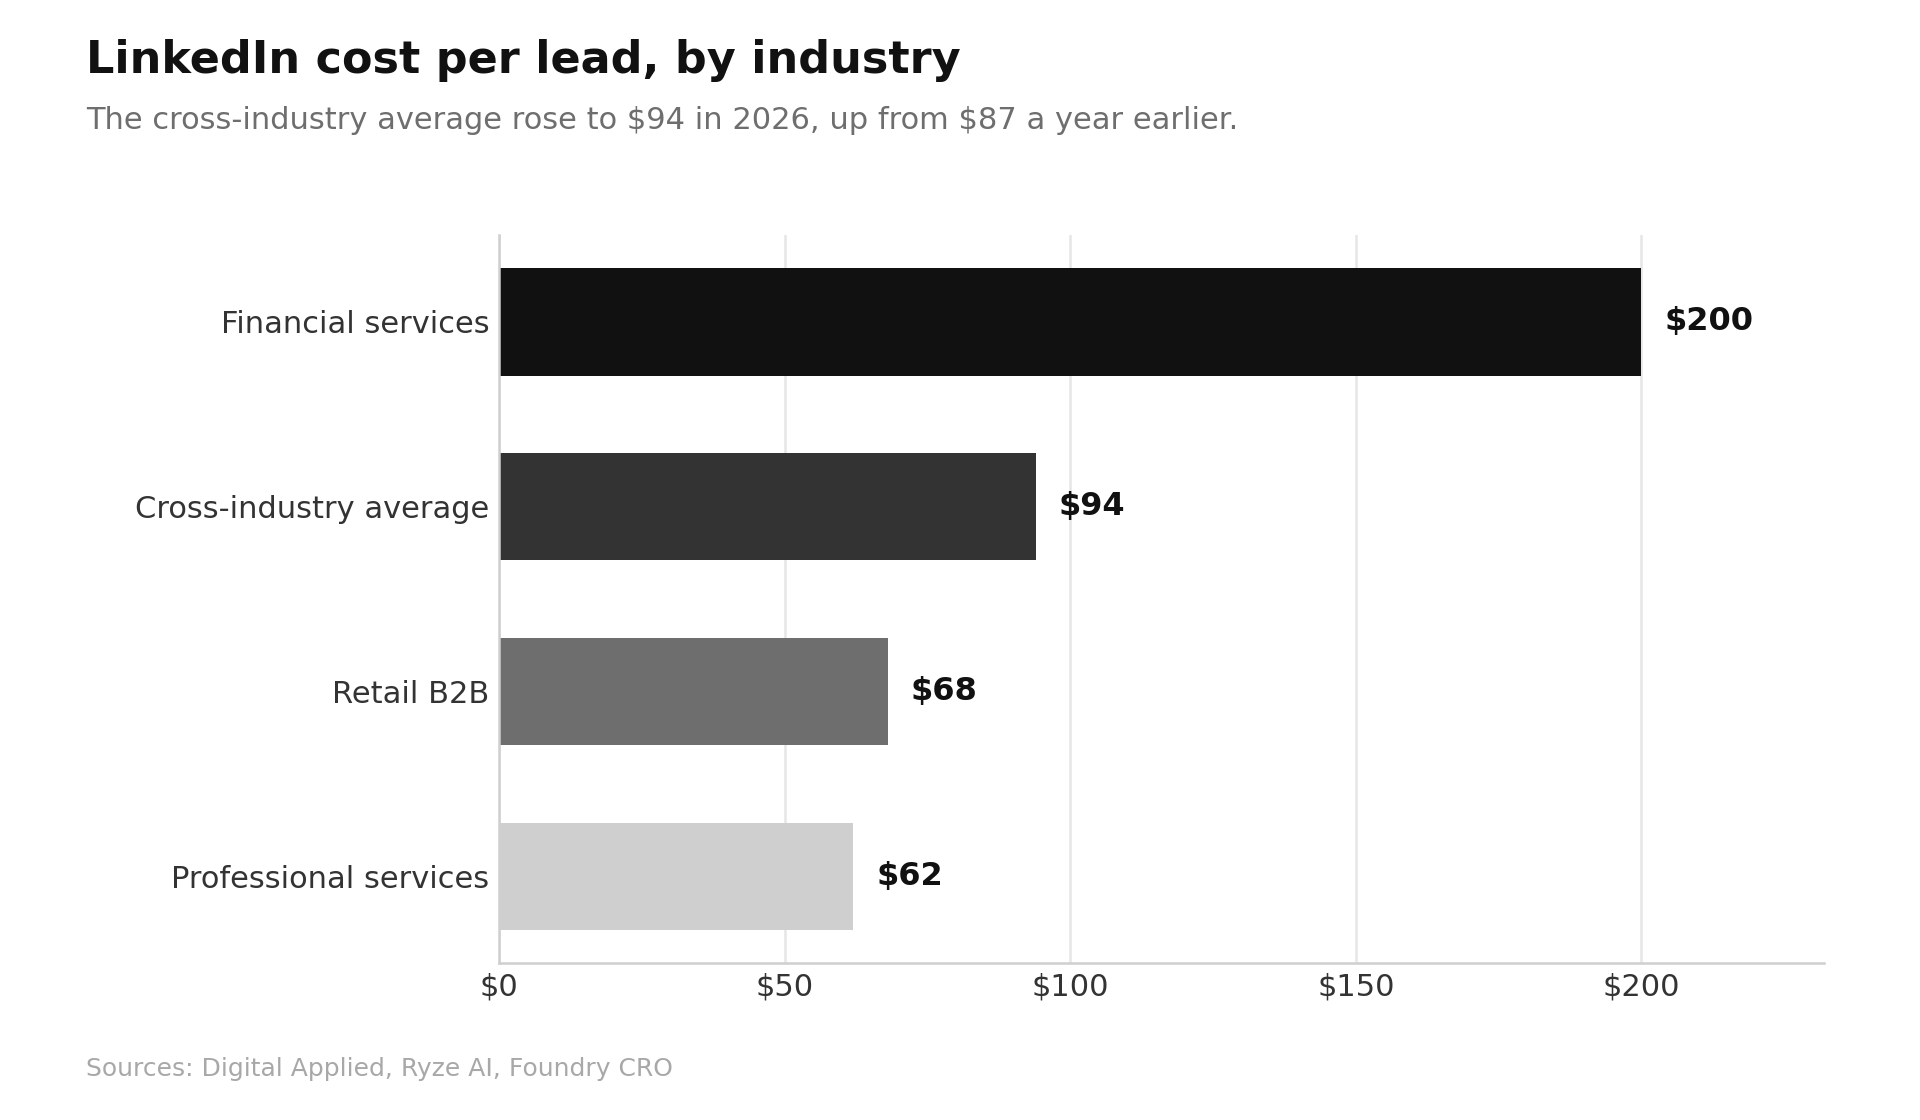
- Cost per lead. CPL varies more by vertical than any single average suggests, running from about $68 at the low end (education) to $200 in financial services, based on $47M in managed LinkedIn spend across 17 industries (Source: Ryze AI).
Professional services carries the lowest CPL at $40 to $85 (Source: Foundry CRO).
If you are comparing platform economics side by side, this breakdown of LinkedIn Ads for B2B growth is a useful companion, as is GrowthCentr's Google Ads statistics report.
ROI and Attribution: The Numbers That Justify the Premium
Raw cost benchmarks make LinkedIn look expensive. Revenue-level data reverses that conclusion.
Dreamdata's first-party attribution analysis found LinkedIn to be the only major paid channel delivering positive return on ad spend, at 121% ROAS overall versus 67% for Google Search and 51% for Meta, with top performers reaching 279% (Source: Lea).
LinkedIn-sourced deals also close at 28.6% to 35% higher ACV than Google-sourced deals (Source: Foundry CRO).
Measurement windows are the trap. The same dataset shows the average B2B customer journey involves 88 touchpoints across 4 channels with 10 stakeholders, spanning 281 days from first LinkedIn ad impression to revenue (Source: Lea).
Roughly 81% of the B2B customer journey now happens outside the sales pipeline, up from 70% the prior year (Source: Dreamdata).
Any team judging LinkedIn on a 30-day attribution window is measuring the wrong thing, a problem GrowthCentr unpacks further in its marketing ROI statistics breakdown.
Brand prominence compounds the effect. LinkedIn B2B Institute research across more than 1,400 campaigns found branded campaigns delivering $12.99 ROAS against $0.68 for generic campaigns (Source: Lea).
Thought Leadership and Employee Advocacy
The largest performance gap on LinkedIn is not between formats. It is between logos and people.
Personal profiles achieve 7% to 8% engagement versus 1% to 2% for company pages, and employee-shared content receives 5 to 10 times higher engagement than brand-created posts (Source: ContentIn).
Content Marketing Institute data shows 76% of B2B marketers rank LinkedIn as the most effective channel for thought leadership (Source: Sprout Social).
Buyers act on it. Around 75% of decision-makers say thought leadership content led them to consider new vendors, and more than half spend at least one hour per week consuming it (Source: Posterly).
With buying groups now routinely spanning more than a dozen stakeholders, executive-led content reaches influencers that gated assets never touch.
Lead Generation and Sales Performance
LinkedIn is responsible for roughly 80% of all B2B leads generated through social media and is 277% more effective at lead generation than Facebook (Source: Charle).
For teams still arguing over MQL versus SQL definitions, channel-level qualification rules matter more than any single platform benchmark.
Reps with strong Social Selling Index scores generate roughly 45% more opportunities and are 51% more likely to hit quota (Source: Martal).
Outreach reply rates vary widely by vertical, from 18% to 25% in recruiting and staffing down to 4.77% in SaaS and technology (Source: Cleverly).
What LinkedIn Marketing Talent Costs
Budget models routinely underprice the labor side of the channel.
Mid-level LinkedIn Ads specialists in the United States earn $72,000 to $88,000 annually with two to four years of dedicated platform experience, while senior specialists handling revenue attribution and multi-channel strategy earn $90,000 to $125,000 (Source: EverestX).
Entry-level roles start between $50,000 and $65,000 (Source: EverestX).
That sits above general paid social pay: broader social media marketing salaries range from $65,000 to $93,000 depending on title (Source: Coursera).
The premium reflects scarcity. When average CPCs sit near $6.50, the difference between a competent and an excellent operator is measured in six figures of wasted spend.
Agency comparison shortlists such as this roundup of LinkedIn marketing agencies for B2B SaaS are worth reviewing before committing to a full-time hire, and GrowthCentr's B2B SaaS CAC benchmarks provide the payback math.
Platform Changes Reshaping 2026 Performance
Three shifts are altering how campaigns perform this year.
- AI campaign automation. LinkedIn's Accelerate mode uses AI to optimize targeting, creative, and bidding, with LinkedIn claiming a 42% improvement in cost per action against classic campaigns (Source: Funnel).
AI bid optimization now manages 72% of LinkedIn ad spend (Source: Ryze AI).
- Predictive Audiences. The Predictive Audiences API combines advertiser first-party or third-party data with LinkedIn's predictive modeling to build high-intent segments, replacing the older lookalike approach (Source: Microsoft Learn).
From August 2026, accounts are capped at 1,000 DMP segments for Matched and Predictive Audiences (Source: Microsoft Learn).
- Creative tooling. Campaign Manager added AI ad copy generation, a reusable Brand Kit, and multi-variant ad creation in mid-2026 (Source: SocialPilot).
How to Read These Numbers for Budget Planning
Three practical conclusions follow from the data above:
- First, LinkedIn only makes economic sense above a threshold. The benchmark guidance is an ACV of $25,000 or more paired with a narrowly defined ICP (Source: The Smarketers).
Below that, search, cold email, and partnerships usually deliver better unit economics.
- Second, format allocation beats budget increases. Thought Leader Ads at $2.29 CPC and document ads at 30% to 40% lower CPL than generic lead forms mean the same budget can produce materially different results (Source: The Smarketers).
- Third, plan attribution windows around a 281-day journey, not a monthly report.
Wider budget context across categories is available in this CMO budget benchmark data and this marketing budget by industry breakdown. For channel mix comparisons, this analysis of ChatGPT Ads versus LinkedIn Ads is a useful next read, alongside GrowthCentr's lead generation statistics and LinkedIn tactics for SaaS founders.
Conclusion
GrowthCentr builds B2B growth programs around verified benchmarks, and LinkedIn is now the channel where those benchmarks matter most.
The 2026 data describes a platform that is more expensive, more concentrated, and more effective than it was two years ago.
Costs are rising, with CPC near $6.50 and CPL reaching $200 in financial services, but revenue-level attribution shows LinkedIn as the only major paid channel returning positive ROAS in B2B.
Organic performance rewards documents, carousels, and executive voices over corporate pages.
Budget share has shifted decisively toward the platform, sitting at 41% of B2B ad spend.
The teams outperforming these benchmarks are not spending more.
They are picking better formats, targeting more precisely, and measuring across a journey that averages 281 days.
Read Next
- How the EU AI Act Changes AI Protection Requirements for Enterprises
- What Is Conversion Rate Optimization (CRO)?
- Cybersecurity Stack Requirements for SOC 2, HIPAA, and ISO 27001 Compliance
FAQs
1. What is the average LinkedIn CPC in 2026?
The average LinkedIn CPC in 2026 is $6.50, up 8% from $6.02 in 2025, with industry-level costs ranging from $4.10 to $15.20 depending on vertical and seniority targeting.
2. What is a good LinkedIn engagement rate in 2026?
A good LinkedIn engagement rate in 2026 is anything at or above the platform-wide average of 5.20% across business pages, with native documents leading all formats at 7.00% (Source: Socialinsider).
3. How much of B2B ad budget goes to LinkedIn in 2026?
LinkedIn captures roughly 41% of total B2B ad budgets in 2026, up two percentage points year over year, while non-branded search declined from 37% to 33% over the same period.
4. What does a LinkedIn lead cost in 2026?
LinkedIn cost per lead in 2026 varies more by vertical than by any single average, running from about $68 in education to $200 in financial services across $47M in managed spend in 17 industries (Source: Ryze AI).
5. Which LinkedIn ad format performs best in 2026?
The LinkedIn ad format performing best in 2026 is Thought Leader Ads, delivering a 2.68% click-through rate at a $2.29 CPC, which is 77% cheaper per click than single image ads.
Disclaimer: This content is provided for informational purposes only and does not constitute legal, financial, or compliance advice. Protocol versions, governance arrangements, and partner counts cited here reflect publicly announced milestones as of August 2026 and are moving quickly. Adoption figures come from vendor and foundation announcements with differing methodologies and should be treated as directional signals rather than guaranteed outcomes.