
Google's advertising business generated $81.6 billion in the second quarter of 2026 alone, a 14.5% increase year over year, with Search and other properties contributing $63.3 billion of that total (source: CNBC).
This report tracks those figures because paid search performance data remains the fastest way to tell whether a media budget is compounding or quietly leaking.
Google Ads sits at the center of a digital advertising market that crossed $835 billion in 2026, yet the platform is simultaneously absorbing the largest structural change in its history as AI Overviews, AI Mode, and automated campaign types rewrite how ads are matched and served.
Cost per click keeps climbing while conversion rates improve, which means the old shortcuts no longer explain account performance.
This report breaks down the Google Ads statistics that matter in 2026: revenue, market share, performance benchmarks by industry, ROI, campaign type adoption, AI automation, salaries, and the regulatory pressure shaping what comes next.
Key Takeaways
- Google ad revenue hit $81.6 billion in Q2 2026, up 14.5% year over year.
- Average Google Ads CPC is $5.42; average cost per lead is $66.69.
- Cross-industry conversion rate reached 8.18%, improving in 87% of tracked industries.
- Performance Max now has four million advertisers; AI bidding drives most platform spend.
- Google holds 48.5% of US search ad spend, below half for the first time.
The Digital Advertising Market in 2026
Google Ads does not operate in isolation.
Understanding its scale requires the market context first.
- Global digital advertising spend reached $835.82 billion in 2026, representing 68.7% of all advertising worldwide (source: PPC Chief).
- Total global advertising crossed $1 trillion for the first time in 2026, growing 5.1% year over year (source: PPC Chief).
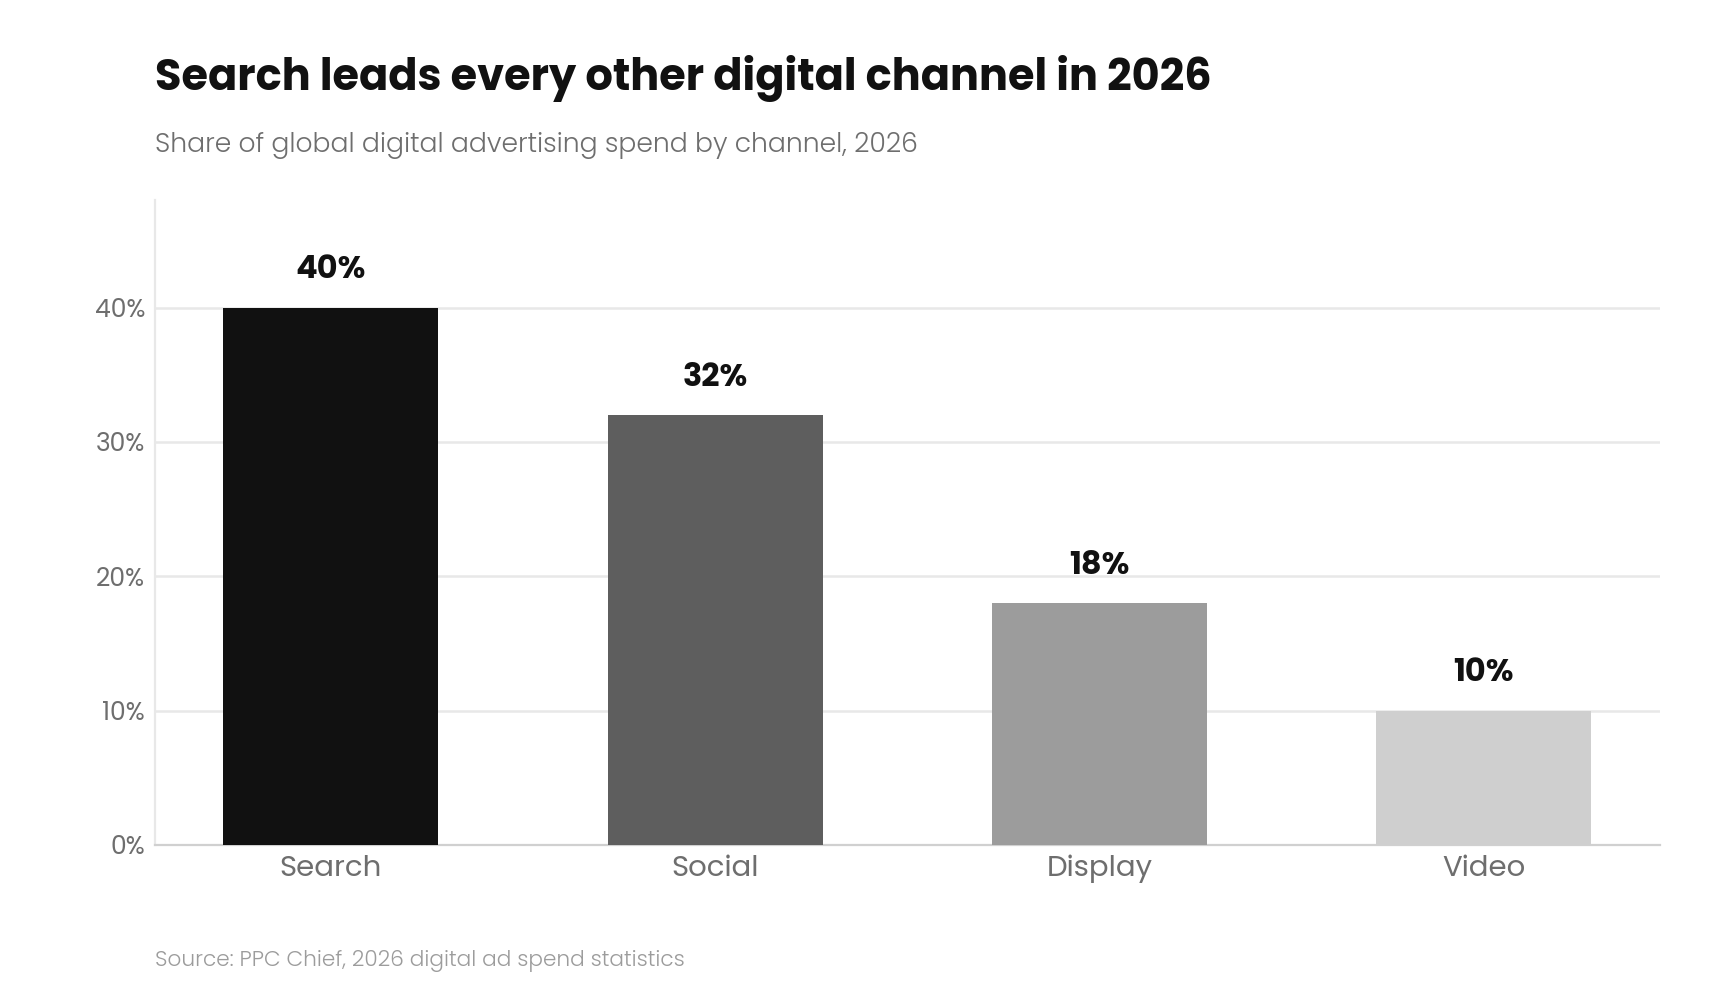
- Search leads channel allocation at roughly 40% of digital spend, ahead of social at 32%, display at 18%, and video at 10% (source: PPC Chief).
- The United States accounts for approximately 40% of global digital ad spend at roughly $272 billion, with China at 18% (source: SearchLab).
- Google, Meta, and Amazon together capture an estimated 64% of all global digital ad revenue (source: SearchLab).
- Programmatic buying accounts for 81.4% of digital display spend and 71.6% of total digital ad spend in 2026 (source: PPC Chief).
Google's Search and PPC Market Share
Market share is the statistic most often misread.
Google is losing share at the margins of a near-monopoly, not losing the market.
- Google held 89.85% of global search traffic as of March 2026, with Bing second at 5.13% (source: SQ Magazine).
- Google Ads holds 80.2% of the global pay-per-click advertising market (source: Rudys.AI).
- Google will earn 48.5% of US search ad spending in 2026, the first time in more than 20 years the figure has fallen below half, with Amazon taking the largest share of the difference (source: EMARKETER).
- Google and YouTube combined are forecast to bring in $229.42 billion in digital ad revenues in 2026, narrowly ahead of Meta's Facebook and Instagram (source: EMARKETER).
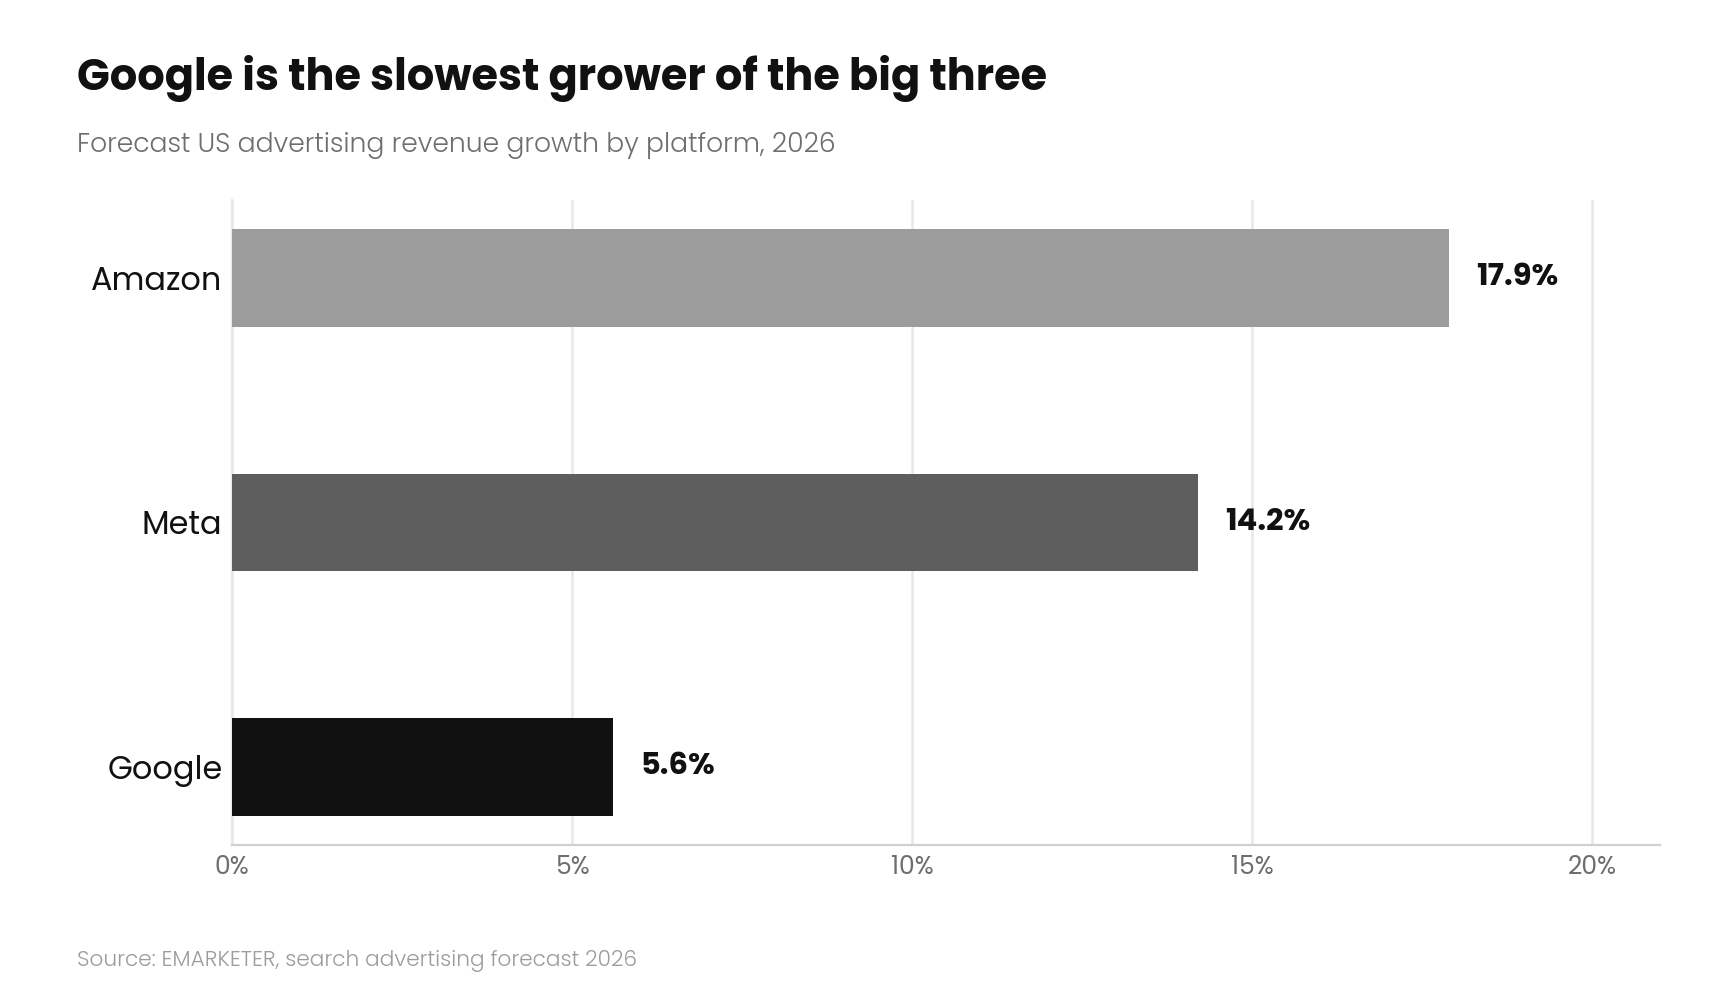
- EMARKETER forecasts Google's US ad revenues will grow 5.6% in 2026, the slowest of the big three platforms, behind Amazon at 17.9% and Meta at 14.2% (source: EMARKETER).
- Search still accounted for the largest share of US digital advertising at 39.8% in the most recent IAB and PwC accounting (source: EMARKETER).
Google Ads Revenue Statistics
- Alphabet reported Q2 2026 total revenue of $119.8 billion, up 24% year over year, its largest quarter on record (source: 9to5Google).
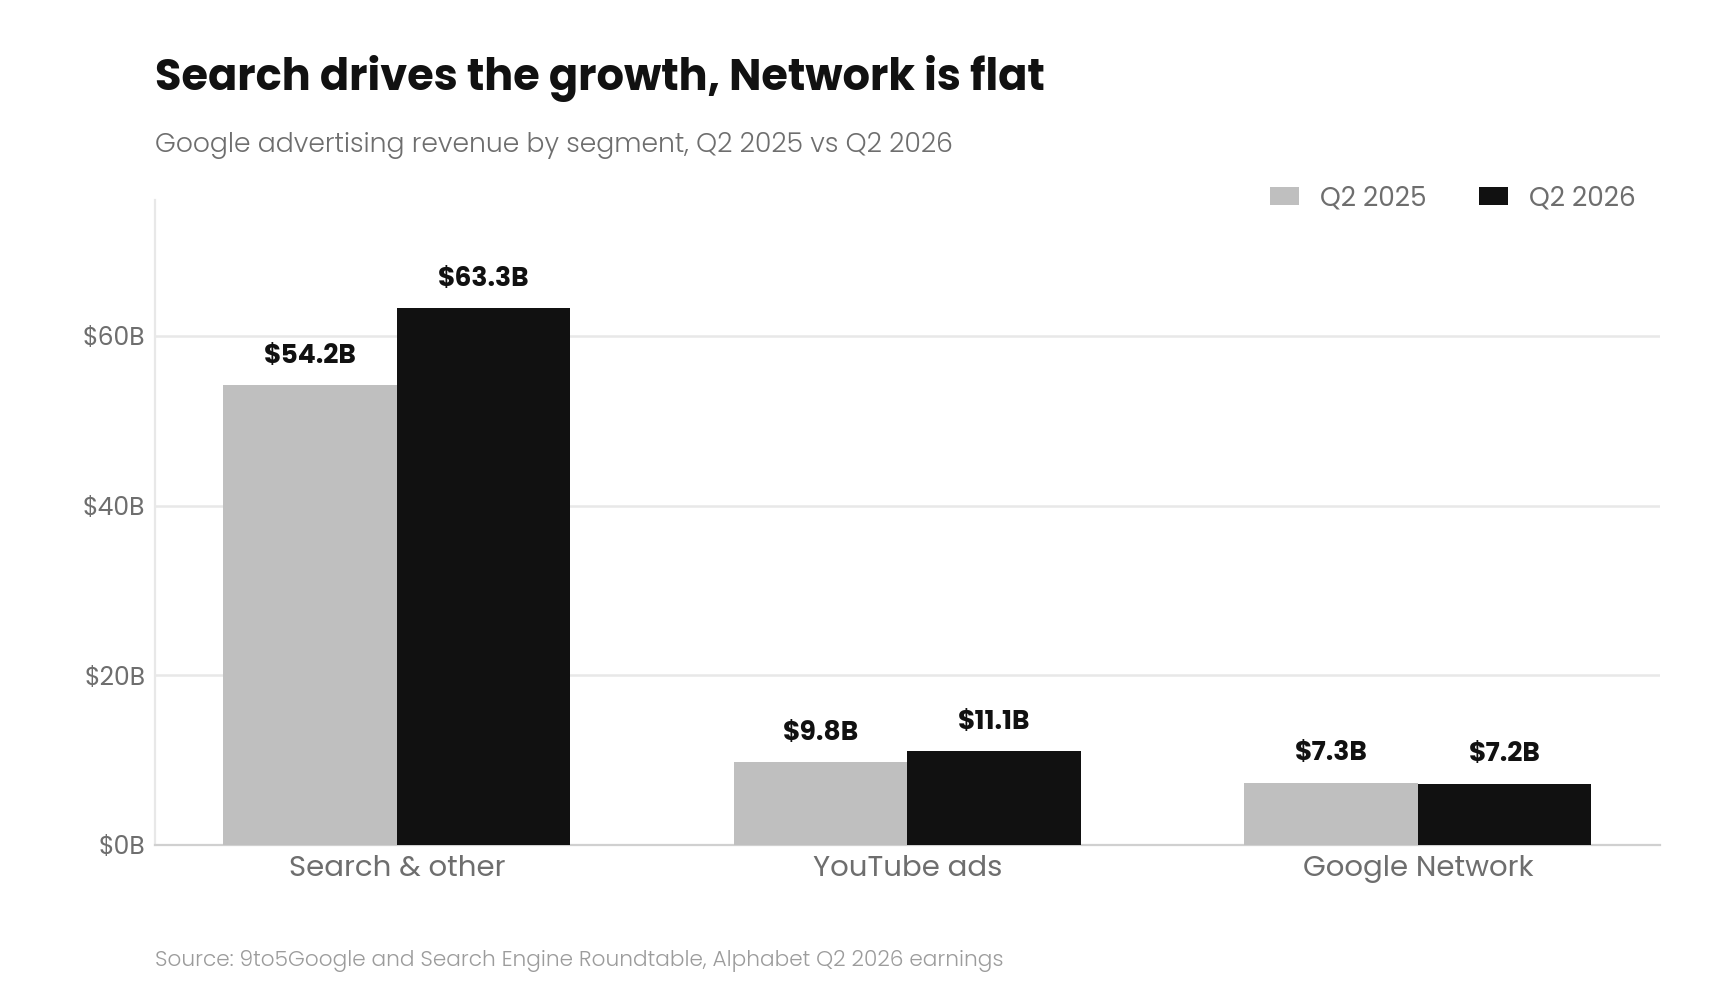
- Google Search and other advertising revenue reached $63.3 billion in Q2 2026, up 17% from roughly $54.2 billion a year earlier (source: Search Engine Roundtable).
- YouTube advertising revenue rose 13% to approximately $11.06 billion in Q2 2026 (source: 9to5Google).
- Google Network was the only advertising line to shrink, declining about 1% year over year (source: FOSS Post).
- Traffic acquisition costs, the share Alphabet pays partners to carry its ads, reached $16.18 billion in Q2 2026 against $14.71 billion a year earlier (source: FOSS Post).
- Google's advertising arm generated $294.69 billion in FY2025, with analysts projecting approximately $318 billion by the end of 2026 (source: DMG).
- Over 7 million businesses and marketing agencies use Google Ads as their primary advertising source (source: Rudys.AI).
Google Ads Performance Benchmarks in 2026
The most widely cited account-level benchmarks come from more than 13,000 US search campaigns across 23 industries measured between April 2025 and March 2026.
| Metric | 2026 Cross-Industry Average |
|---|---|
| Click-through rate | 6.64% |
| Cost per click | $5.42 |
| Conversion rate | 8.18% |
| Cost per lead | $66.69 |
Source: WordStream
- Average CPC of $5.42 is more than double the $2.32 recorded when these benchmarks began in 2016 (source: Web Tonic).
- Cost per lead fell for the first time in five years, landing at $66.69 (source: Web Tonic).
- Conversion rate improved in 87% of industries, meaning cheaper leads came from better closing rather than cheaper clicks (source: Web Tonic).
- A separate Q1 2026 dataset places cross-industry Search CPC at $2.96, up 12% from $2.64 in Q1 2025, with Display CPC at $0.44 (source: Ryze).
The gap between the $5.42 and $2.96 figures is a methodology difference, not a contradiction.
- One measures US lead-generation search campaigns
- Other blends a wider global account set.
Compare your account to the dataset that matches your model.
Cost Per Click by Industry
- Attorneys and Legal Services recorded the highest average CPC at $9.87 (source: Search Engine Journal).
- Home and Home Improvement followed at $8.33 (source: Hawky).
- Arts and Entertainment posted the lowest average CPC at $1.63, with Restaurants and Food at $2.05 (source: Hawky).
- Real Estate saw the largest year-over-year CPC increase at 27.27%, followed by Personal Services and Health and Fitness at roughly 23.41% each (source: WordStream).
- E-commerce search CPC climbed 33% year over year, one of the steepest category increases recorded (source: Rudys.AI).
- Attorneys and Legal Services also carried the highest cost per lead at $131.63 (source: Search Engine Journal).
Industries with the lowest CTRs, typically legal, insurance, and medical, are also those with the highest CPCs.
Low CTR depresses Quality Score, which raises CPC, so the correlation is mechanical rather than coincidental (source: Digital Applied).
Google Ads ROI and ROAS Statistics
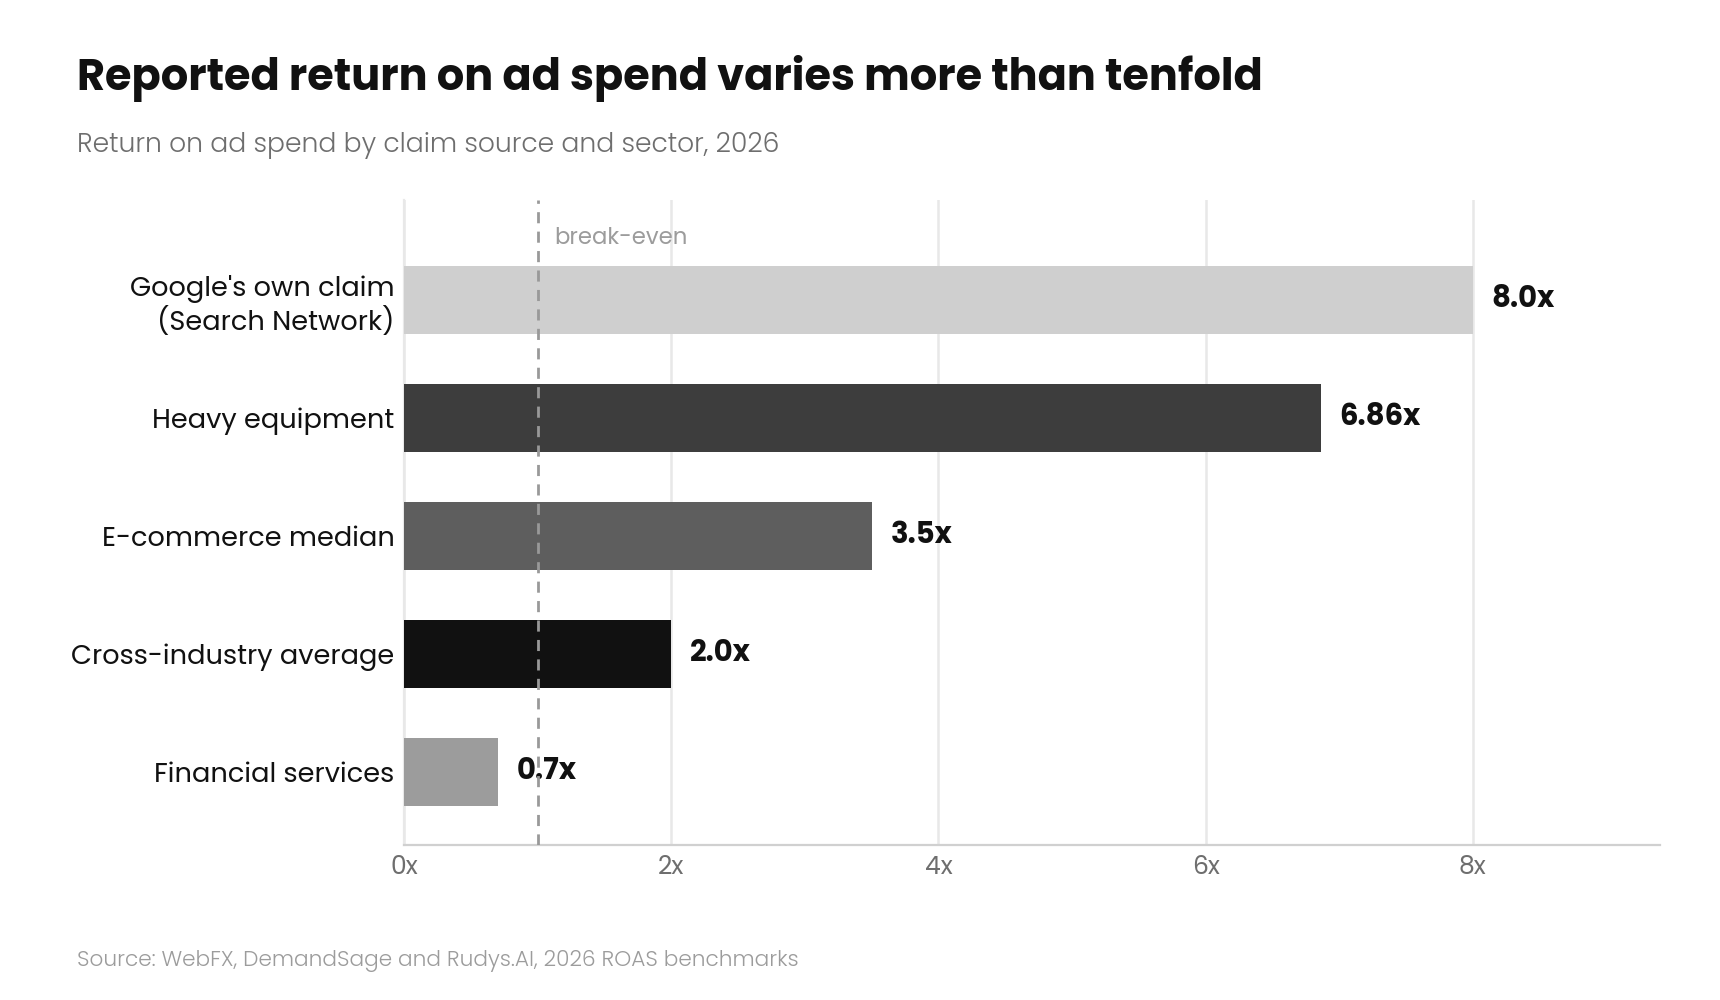
- Google's own economic impact research puts the return at $8 in revenue for every $1 spent on the Search Network (source: WebFX).
- Independent benchmark aggregation places the realistic average closer to $2 for every $1 spent, a 200% ROI (source: DemandSage).
- Median ROAS across Google Ads campaigns declined 10.03%, with CPCs rising 12.88% and conversion rates falling 9.28% in the same period (source: Rudys.AI).
- The median ROAS for Google Ads e-commerce campaigns heading into 2026 was approximately 3.5x (source: Rudys.AI).
- Paid search ROAS ranges from 0.7x in financial services to 6.86x in heavy equipment (source: WebFX).
- Platform-reported ROAS runs 2 to 5 times higher than true incremental impact, based on analysis of 253 media mix models covering $383 million in spend (source: Foundry CRO).
- People who click Google Ads are 50% more likely to buy than organic visitors (source: DemandSage).
That last incrementality figure is the most important number in this section.
Any ROAS target set from platform-reported data alone is measuring attributed revenue, not caused revenue.
Campaign Type Statistics: Shopping, Search, and Video
- Google Shopping CPC averages $0.66 compared with $5.26 for Search, making it the cheapest high-intent traffic on the platform (source: Rudys.AI).
- Shopping Ads carry a 0.86% CTR and a 1.91% average conversion rate (source: DemandSage).
- Shopping Ads drive 85.3% of all clicks on Google Ads retail campaigns, and 76.4% of US retail search ad spending goes to Google Shopping (source: Affinco).
- Performance Max now captures 62% of Shopping spend and 61% of Shopping-attributed sales, though Standard Shopping delivers a $5 lower CPA at $38.87 versus $43.91 (source: Foundry CRO).
- Average CPA is $48.96 for Search campaigns, $75.51 for Display, and $45.27 for Shopping (source: Affinco).
- YouTube advertising ROI runs 20 to 30% higher than traditional TV advertising (source: Affinco).
- More than 1.7 billion unique viewers globally watched World Cup-related videos on YouTube during the 2026 tournament (source: CNBC).
AI and Automation Adoption Statistics
Automation is no longer an option inside Google Ads. It is the default architecture.
- Performance Max now has four million advertisers on the platform, all eligible to serve within AI Overviews inventory (source: AdExchanger).
- That is a fourfold increase in roughly one year, from the one million PMax advertiser milestone announced twelve months earlier (source: AdExchanger).
- Smart Bidding and Performance Max together account for 78% of all Google Ads spend in 2026 (source: Digital Applied).
- 86% of advertisers have adopted Smart Bidding, and Google reports it lifts conversions roughly 20% at equivalent budget (source: BizIQ).
- Advertisers using AI bidding report 22% lower cost per conversion on average versus manual CPC, though results vary sharply by account maturity (source: Digital Applied).
- AI Max for Search campaigns average 7% more conversions or conversion value at a similar CPA or ROAS when the full feature suite is enabled (source: Google).
- AI Max reached hundreds of thousands of advertisers within its first year, making it the fastest-growing AI search product in Google's portfolio (source: AdExchanger).
Independent testing tells a less flattering story. Published research on AI Max found competitor impressions in 69% of tested cases, a 16% median CPA increase, and a 35% increase in invalid traffic (source: Connective).
Campaigns using automatically created assets and campaign-level broad match begin auto-upgrading to AI Max in September 2026, with the Dynamic Search Ads sunset pushed to February 2027 (source: Google).
AI Overviews and the Shifting Click Economy
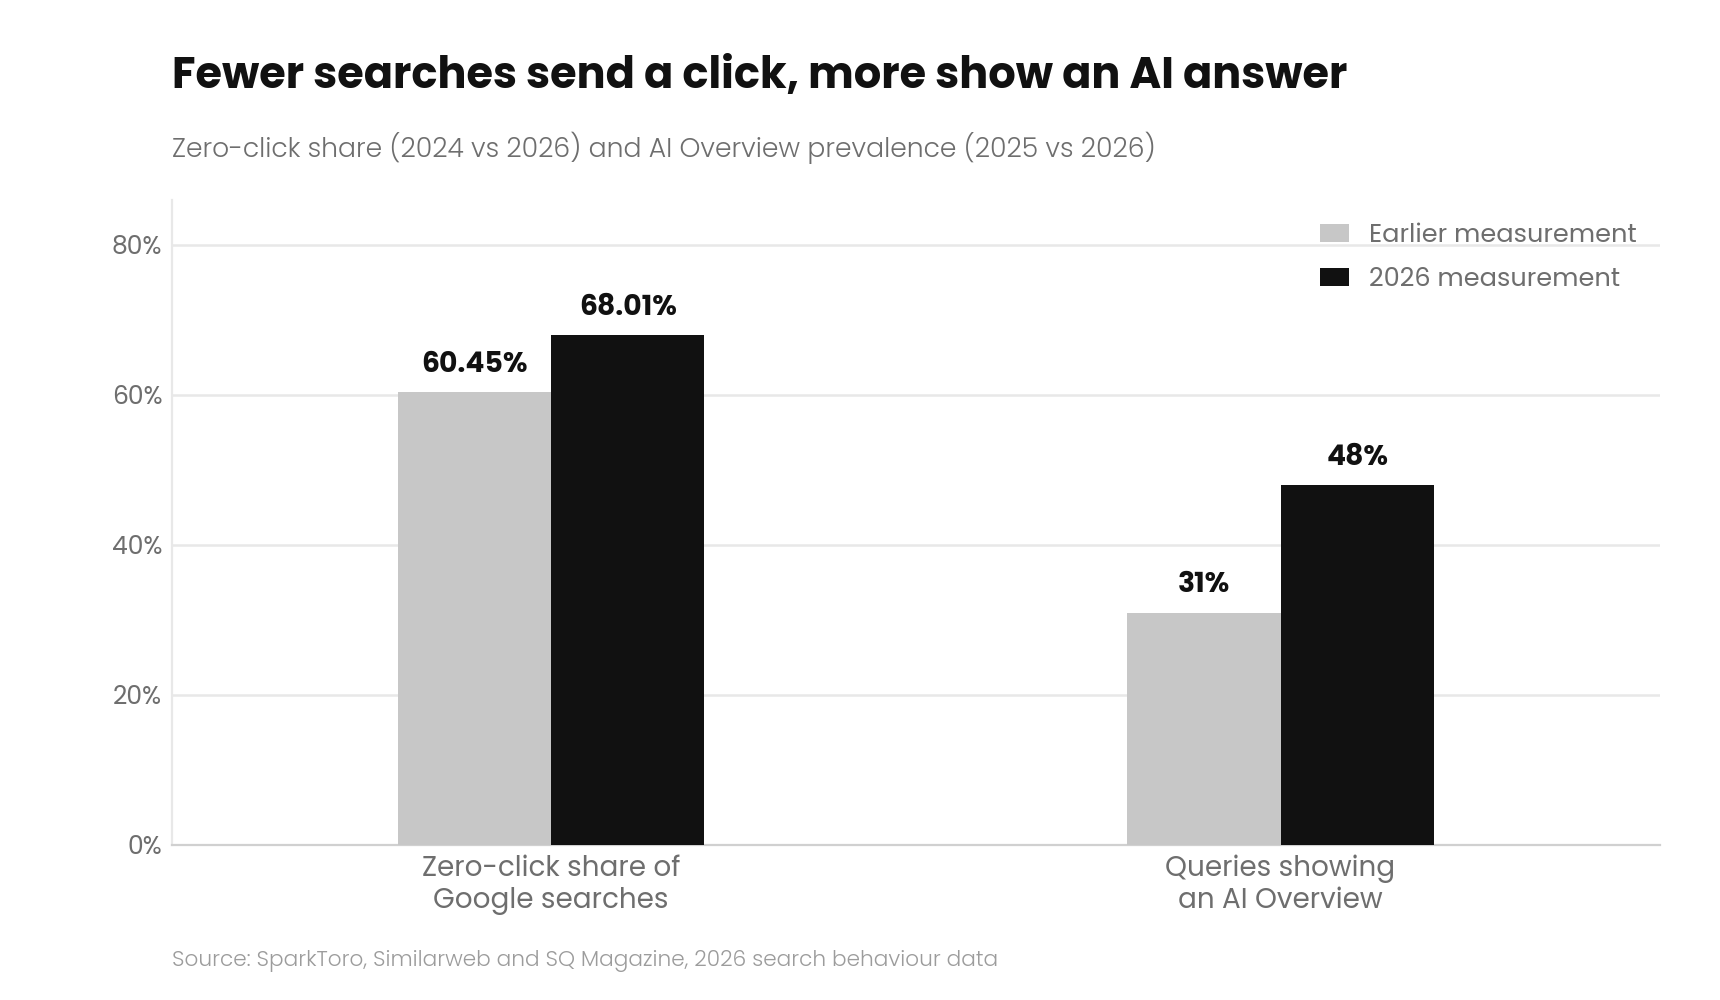
- Zero-click searches now represent 68.01% of all Google searches in the first four months of 2026, up from 60.45% in 2024 (source: SparkToro).
- AI Overviews appeared on approximately 48% of tracked queries as of February 2026, up from 31% a year earlier (source: SQ Magazine).
- AI Overviews reach approximately 2 billion monthly users worldwide across more than 200 countries and territories (source: Memeburn).
- Paid CTR on AI Overview queries fell from 19.70% to 6.34%, a 68% decline, across the 2024 to 2025 measurement window (source: SQ Magazine).
- That trend reversed in Q1 2026: paid CTR with AI Overviews present rose from 14.6% to 16.2%, while paid CTR without AI Overviews declined from 26% to 21.8% (source: Memeburn).
- Organic CTR on AI Overview queries climbed from a floor of 1.3% in December 2025 to roughly 2.4% by February 2026 (source: SQ Magazine).
Paid clicks are migrating toward AI Overview surfaces rather than disappearing.
The advertisers exposed to that inventory are capturing an increasing share of a shrinking click pool.
Device and Audience Statistics
- Approximately 63% of total Google Ads clicks come from smartphones (source: We Are Tenet).
- Google captures roughly 34.7% of global mobile ad spend, totaling approximately $112.4 billion in 2026 (source: Amra and Elma).
- Mobile generates roughly 60% of Shopping impressions, but desktop converts at 4.31% versus mobile at 3.48%, a 24% gap (source: Foundry CRO).
- Google Ads reaches approximately 4.77 billion internet users worldwide, with over 8.5 billion searches performed daily (source: Rudys.AI).
- Over 63% of people have clicked a Google ad at some point (source: DemandSage).
Budget and Spend Statistics
- Most companies spend between $1,000 and $10,000 per month on Google Ads campaigns (source: We Are Tenet).
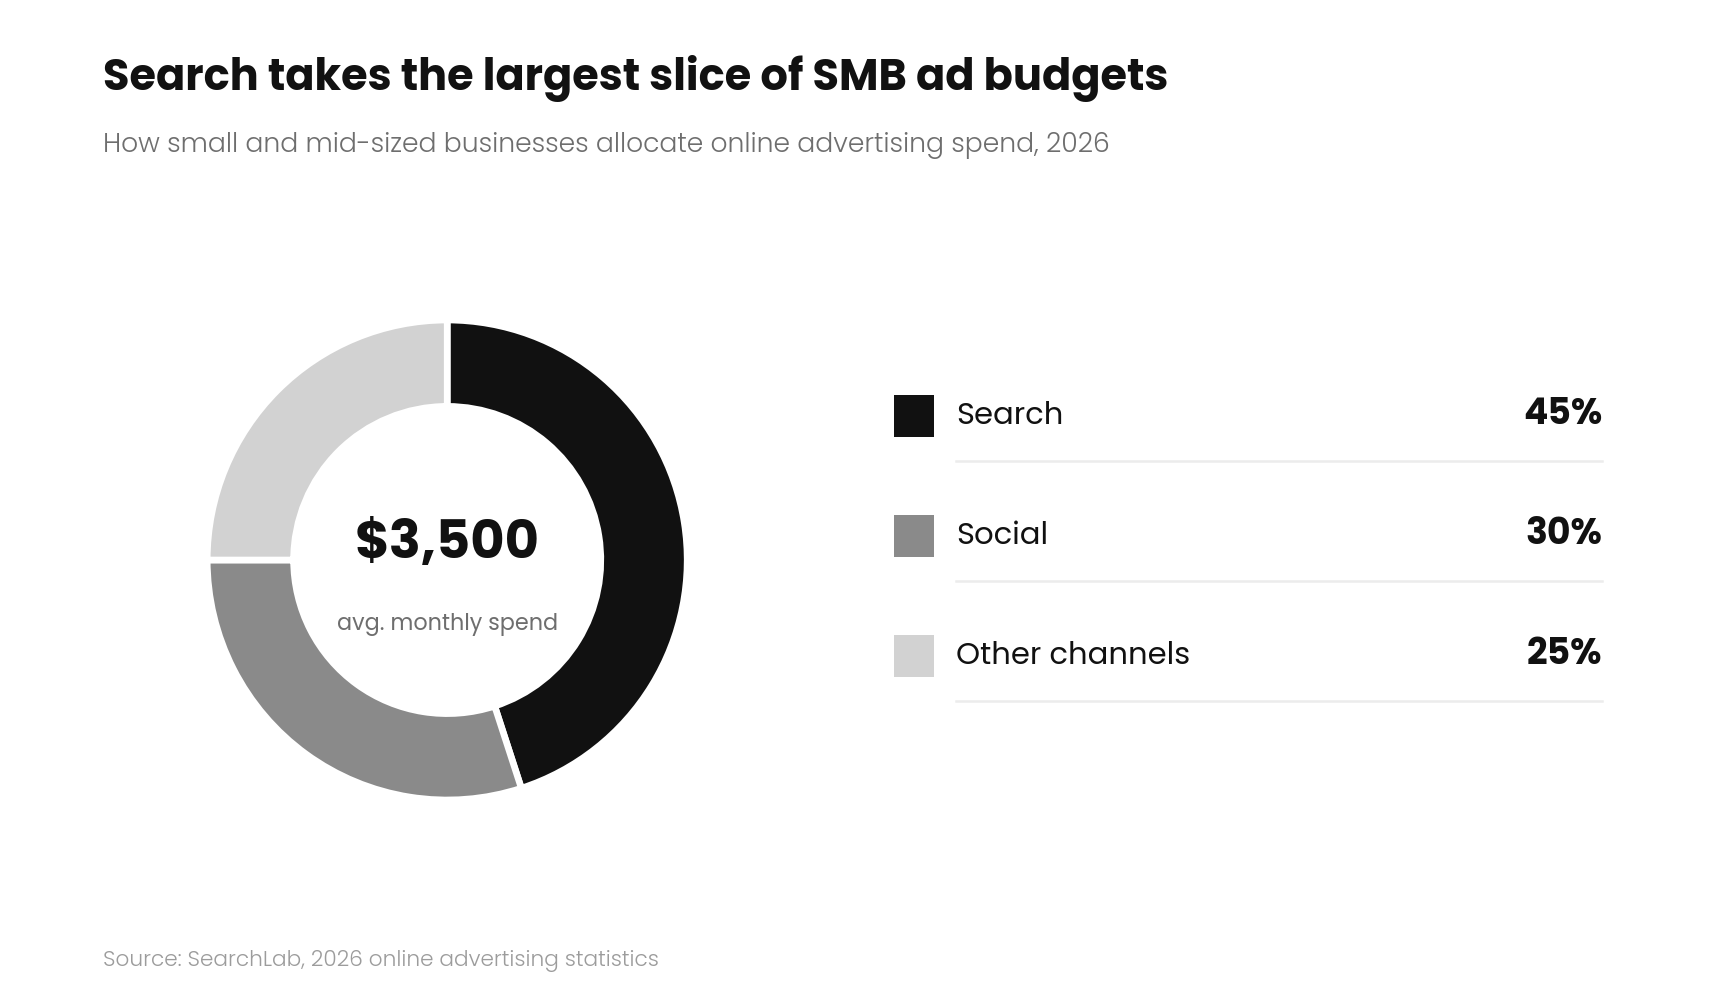
- SMBs invest an average of $3,500 per month in online advertising globally, with 45% going to search (source: SearchLab).
- More than 65% of small and mid-sized businesses use Google Ads for PPC (source: DemandSage).
- Q4 Shopping CPCs spike 25 to 30%, with Black Friday CPMs rising 18% year over year, while Q1 offers the cheapest clicks of the year (source: Foundry CRO).
- Remarketing delivers 30 to 50% lower CPA compared with cold traffic (source: Affinco).
Google Ads Salary and Talent Statistics
Rising automation has not removed the labor cost. It has shifted it toward strategy and measurement roles.
| Role | Average US Salary | Range |
|---|---|---|
| Google Ads Specialist (ZipRecruiter) | $62,671 | $44,000 to $89,000 |
| Google Ads Specialist (Glassdoor) | $79,673 | $59,754 to $145,763 |
| Google Ads Manager (ZipRecruiter) | $106,825 | $88,000 to $165,000 |
| Google Ads Manager (Glassdoor) | $86,878 | $65,158 to $157,542 |
Sources: ZipRecruiter, Glassdoor, ZipRecruiter, Glassdoor
- Entry-level PPC specialists earn approximately $47,833 annually, while senior specialists with eight or more years of experience reach roughly $81,518 (source: Ali Raza).
- Ads Specialist roles inside Google itself average an estimated $93,851 per year (source: Glassdoor).
- Specialists who add SEO, analytics, or cross-platform skills command measurably higher pay, with complementary skill averages clustering between $49,269 and $51,584 (source: Ali Raza).
Regulatory and Competitive Pressure
- A US federal judge prohibited exclusive distribution contracts for Google Search and ordered search data sharing with rivals, but stopped short of structural remedies on product design (source: Similarweb).
- The European Commission opened a separate antitrust investigation into whether AI Overviews and AI Mode misuse publisher content (source: TNW).
- AI Overviews have been correlated with a 58% reduction in click-through rates to source websites, now central to multiple antitrust filings (source: TNW).
- Gemini reached 25% of US daily active user share among AI assistants, narrowing the gap with ChatGPT (source: EMARKETER).
Conclusion
The figures in this report should be read the way any disciplined advertiser reads them: as a signal about where efficiency is moving, not as a verdict on the platform.
Google Ads in 2026 is a larger, more expensive, and more automated auction than it was two years ago.
Revenue keeps climbing at double-digit rates, clicks keep getting more expensive, and conversion rates are improving fast enough to offset most of that inflation.
The real shift is structural.
Automated campaign types now carry the majority of spend, AI surfaces are absorbing an increasing share of paid clicks, and platform-reported returns overstate incremental impact by a wide margin.
The advertisers who win from here are the ones measuring causation rather than attribution.
Read Next
FAQs
1. What is the average cost per click in Google Ads in 2026?
The average cost per click in Google Ads in 2026 is $5.42 across 23 industries in US search campaigns, though a broader global dataset places it at $2.96. Legal services pay the most at $9.87, while Arts and Entertainment pays the least at $1.63.
2. What is a good conversion rate for Google Ads in 2026?
A good conversion rate for Google Ads in 2026 is anything at or above the 8.18% cross-industry average, though the correct target depends entirely on your vertical, funnel stage, and price point.
3. How much revenue does Google Ads generate?
Google Ads generated $81.6 billion in advertising revenue in Q2 2026 alone, up 14.5% year over year, with full-year 2026 revenue projected to approach $318 billion.
4. What percentage of Google Ads spend is driven by AI automation?
The percentage of Google Ads spend driven by AI automation is 78% in 2026, with Smart Bidding and Performance Max accounting for the majority of platform investment and 86% of advertisers now using Smart Bidding.
5. What is the average ROI of Google Ads?
The average ROI of Google Ads is approximately $2 in revenue for every $1 spent, or 200%, based on independent benchmark aggregation. Google's own economic impact research cites $8 per $1 on the Search Network, and platform-reported ROAS typically overstates incremental impact by 2 to 5 times.
Disclaimer: This content is provided for informational purposes only and does not constitute legal, financial, or compliance advice. Protocol versions, governance arrangements, and partner counts cited here reflect publicly announced milestones as of August 2026 and are moving quickly. Adoption figures come from vendor and foundation announcements with differing methodologies and should be treated as directional signals rather than guaranteed outcomes.