

Last updated: September 2026
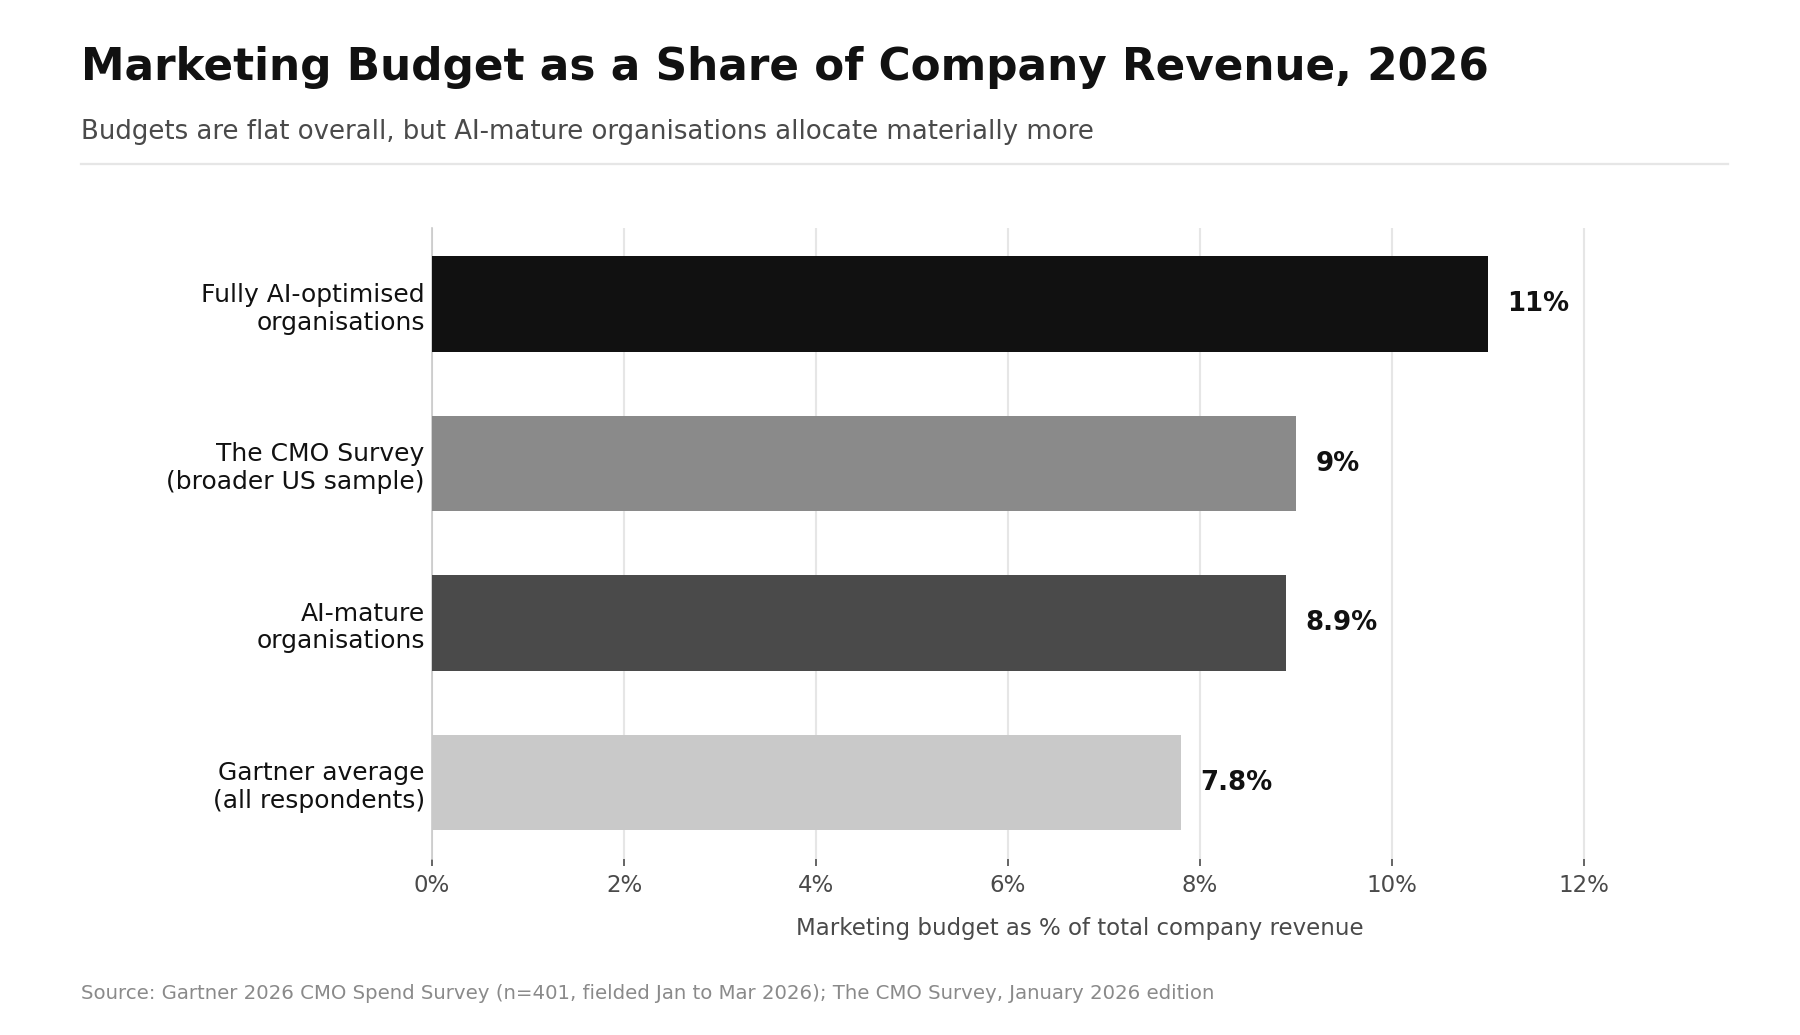
Marketing budgets have plateaued at 7.8% of company revenue in 2026, roughly 18% below the mean allocation of four years earlier (source: Gartner).
GrowthCentr builds and documents the growth systems that connect every marketing dollar to a revenue line, which is why GrowthCentr tracks return data continuously rather than once a year.
Return on investment has become the deciding variable in nearly every budget conversation, as CMOs defend spend against CFO-grade scrutiny while attribution models degrade and AI absorbs a growing share of the budget.
This report compiles the marketing ROI statistics that matter in 2026, covering budget benchmarks, channel-level returns, ROAS by platform, B2B unit economics, AI returns and the measurement gap that separates confidence from proof.
Key Takeaways
- Marketing budgets sit at 7.8% of revenue, roughly 18% below 2022 levels.
- 85% of marketers claim ROI confidence, but only 32% measure holistically.
- Email returns $36 per $1 spent, against modeled returns near $1.70 for search.
- Median B2B SaaS LTV:CAC is 3.2:1 with 8.6-month CAC payback.
- Only 41% of marketers can demonstrate ROI on AI investments.
What Changed in the September 2026 Update
This refresh replaces secondary citations with primary survey sources, adds HubSpot's 2026 State of Marketing data, and removes channel return figures that could not be traced to a primary dataset.
- The CMO Survey's 35th edition (308 US marketing leaders, published March 31, 2026) found marketing budgets at 9.0% of company revenue and 9.6% of overall budgets, with spending up just 1.7% over the prior 12 months, the smallest increase since 2021 (Source: The CMO Survey).
- When profits fall short, 53.1% of executives now focus on cutting expenses, up from 46% a year earlier, and marketing is cut 45.4% of the time (Source: The CMO Survey).
- In HubSpot's 2026 State of Marketing (1,500+ marketers), measuring ROI is the top challenge at 33%, and 73% say their budget receives more scrutiny than in the past (Source: HubSpot).
- 67.5% of marketers now say they know how to measure AI impact, up from 48% in 2025, and short-form video leads media formats for ROI at 48.6% (Source: HubSpot).
- AI referral traffic to US retail sites rose 62% year over year in July 2026, converting 60% better than non-AI traffic and generating 53% more revenue per visit (Source: Digital Commerce 360, citing Adobe). GrowthCentr's guide to product feed optimization for AI shopping agents covers how to capture that channel.
- LinkedIn Marketing Solutions revenue grew 16% year over year in the quarter ended June 30, 2026 (Source: LinkedIn); channel-level detail sits in GrowthCentr's LinkedIn marketing statistics report.
GrowthCentr's take: the CMO Survey's cut-first reflex and HubSpot's scrutiny numbers point the same way. Budgets that cannot show incremental return get trimmed first, so the measurement work in this report is now a budget-protection exercise, not a reporting nicety.
Marketing Budget Benchmarks Set the ROI Baseline
Every ROI calculation starts with the denominator, and in 2026 that denominator is under pressure.
Gartner reports marketing budgets averaging 7.8% of company revenue in its 2026 CMO Spend Survey, fielded January through March 2026 among 401 marketing leaders (source: Gartner).
The CMO Survey, run by Duke, Deloitte and the AMA, puts the figure at 9.0% of revenue in its spring 2026 edition, with the gap driven by sampling rather than disagreement about the market (source: The CMO Survey).
Growth has slowed to a near standstill.
Marketing spending grew just 1.7% over the prior 12 months in early 2026, the weakest rate since 2021 (source: The CMO Survey).
Inside that flat budget, allocation is shifting.
Paid media reached 31.4% of the marketing budget in 2026, the only growing category, while martech fell to 19.4%, a five-year low down from 26.6% in 2021 (source: Chief Marketer).
For teams benchmarking their own allocation, the breakdown of SaaS marketing budget benchmarks and where CMO budgets are going in 2026 provide category-level comparisons.
ROI Is Now the Primary Criterion for Budget Allocation
The metric that decides funding has changed.
38% of marketers now prioritize sales or ROI as their top success metric, a clear move away from reach-first thinking (source: Nielsen).
A further 60% of marketers now incorporate both reach or frequency and ROI into cross-media measurement (source: Nielsen).
That shift has channel consequences.
Demonstrable ROI is the primary criterion for future budget allocation, which is pushing CMOs toward digital channels where returns are most visible, even when those channels are not necessarily the most effective (source: NIQ).
Retail media is a direct beneficiary, with 69% of CMOs viewing it as critical and 67% planning to increase investment (source: Marketing Dive).
The Measurement Confidence Gap
The single most revealing statistic in this report is the distance between what marketers believe and what they can prove.
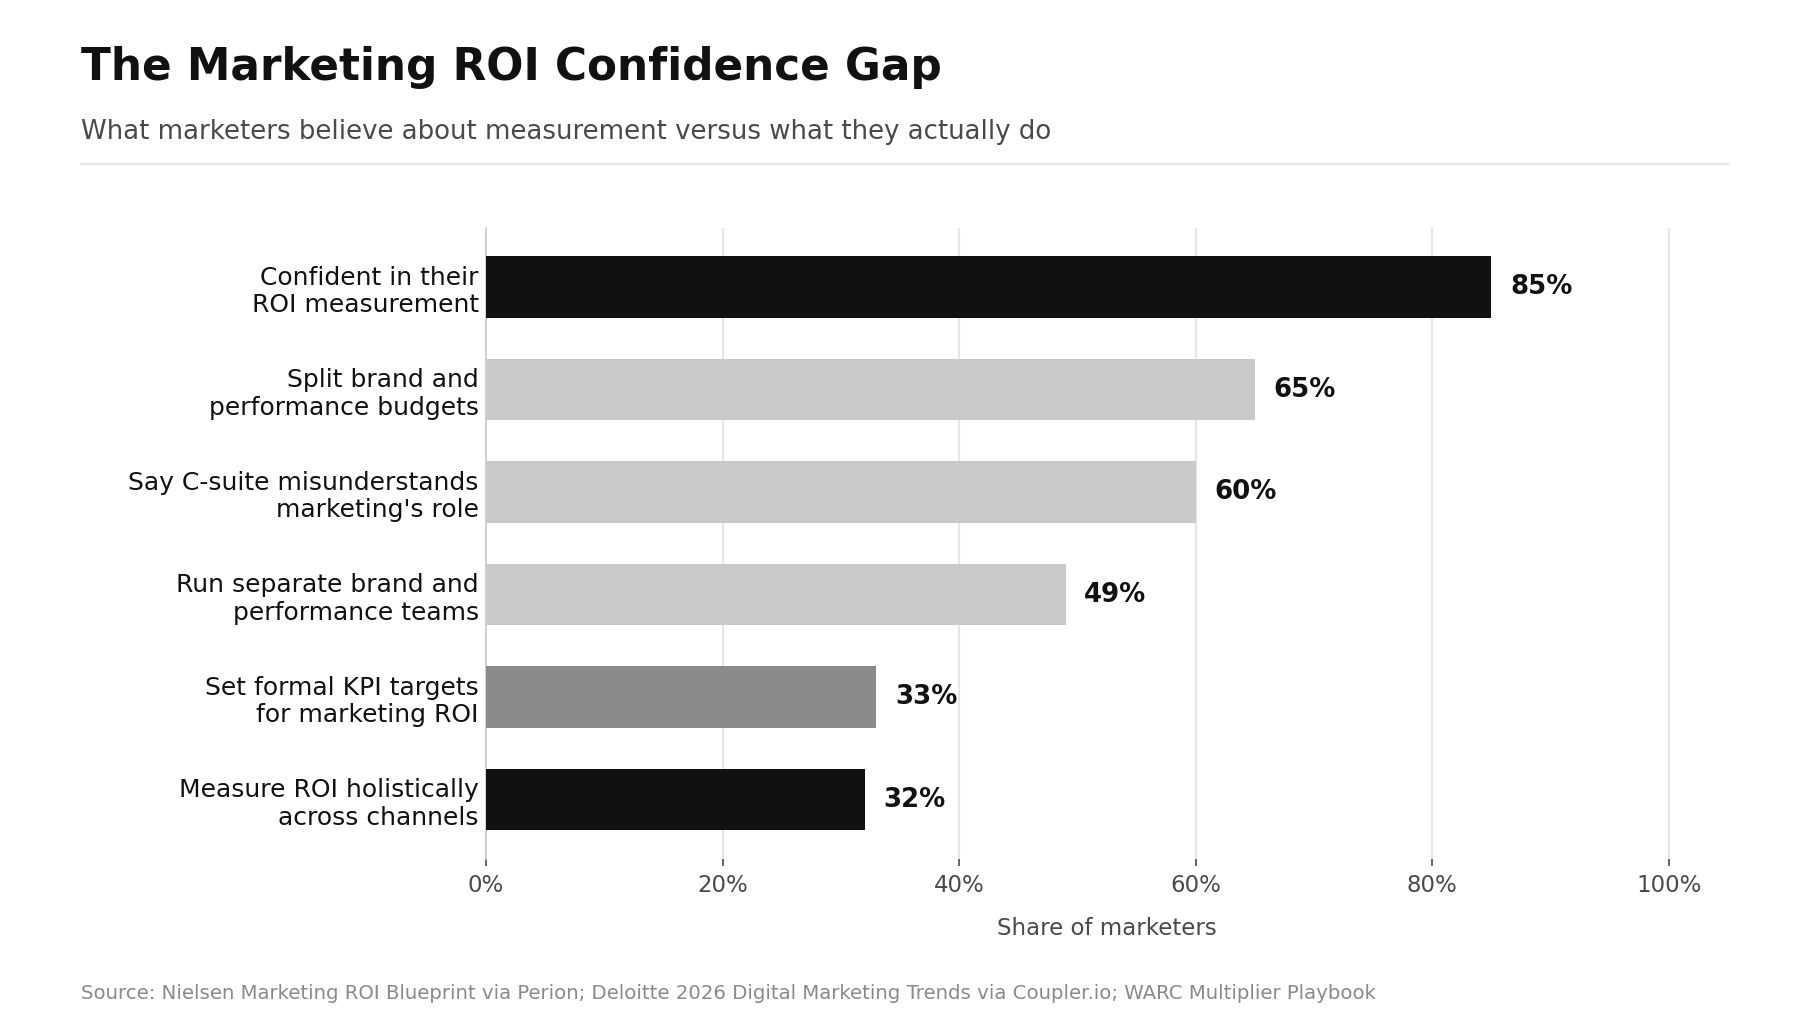
85% of marketers say they are confident in their ROI measurement, yet only 32% actually measure it holistically across channels (source: Perion).
Formal accountability is thinner still. Only 33% of enterprises set KPI targets for marketing ROI, despite marketing sitting under CFO-level scrutiny (source: Coupler.io).
Structural fragmentation compounds the problem: 49% of companies still run separate brand and performance teams and 65% still split their budgets between the two, while 60% of marketers say their own C-suite does not fully understand marketing's role (source: Perion).
This is the core reason B2B attribution stays broken for most organizations. Before optimizing spend, teams need clean definitions upstream, starting with how MQLs and SQLs are counted.
Marketing ROI Statistics by Channel
Channel-level returns vary by more than an order of magnitude. The table below pairs email benchmarks with modeled media returns from Keen's 2026 Marketing Investment Framework.
| Channel | Return per $1 spent |
|---|---|
| Email marketing (Litmus) | $36 |
| Email marketing (DMA UK tracker, 2019) | £42 per £1 (older, not directly comparable) |
| Audio (Keen modeled ROI) | About $2.50 |
| Display (Keen modeled ROI) | About $2.00 |
| Streaming video (Keen modeled ROI) | About $1.90 to $2.00 |
| Search (Keen modeled ROI) | About $1.70 |
Email remains the outlier. Litmus data puts email ROI at $36 for every $1 spent; the widely quoted $42 figure comes from the DMA's 2019 UK tracker (£42 per £1) and is not directly comparable (Source: CO Consulting). Keen's modeled returns run about $1.70 for search, about $2.00 for display, and about $2.50 for audio (Source: Coupler.io).
Marketer confidence matches the data. 41% of marketing professionals rank email as their most effective channel, ahead of social media and paid search at 16% each (source: Omnisend).
Automation is the clearest lever inside the channel, with Klaviyo reporting that flows deliver about 41% of email revenue from just 5.3% of sends (source: CO Consulting).
On the content side, short-form video is the top ROI format in 2026, cited by 48.6% of marketers, ahead of long-form video at 28.6% (Source: HubSpot).
Teams comparing channel efficiency should also review current email open rate benchmarks and GrowthCentr's lead generation statistics.
ROAS Benchmarks by Platform
Return on ad spend tightened across nearly every platform this year.
ROAS declined 10.03% year over year across industries in 2026, driven primarily by cost inflation rather than conversion collapse (source: Foundry CRO).
| Platform | 2026 ROAS benchmark |
|---|---|
| Google Ads (median) | 3.31x |
| Google Shopping | 5.8x average |
| Meta Ads (median) | 2.19x |
| Meta retargeting | 8.0x or higher |
| TikTok Ads | 2.0x to 2.5x |
| LinkedIn Ads | 1.5x to 2.5x |
Median ROAS in 2026 sits at 3.31x on Google Ads and 2.19x on Meta, per Varos data (source: Superscale).
Google Shopping campaigns achieve the highest platform ROAS at 5.8x average because they capture commercial intent, while Meta prospecting typically ranges from 1.8x to 3.2x (source: Ryze AI).
Two cost inputs explain most of the decline.
CPCs rose 10% to 25% while conversion rates fell 9.28%, and AI Overviews reduced paid click-through rates by 58% to 68% on affected queries (source: Foundry CRO).
Current Google Ads CPC benchmarks and Facebook Ads CPC data show the same pressure at platform level, and GrowthCentr's Google Ads statistics report covers the auction dynamics behind it.
One under-used lever: lifting landing page conversion rate from 2% to 3% increases ROAS by 50% at zero additional spend (source: Foundry CRO).
Benchmarks for that lever appear in current landing page conversion rate data.
Brand Versus Performance: Where Half the ROI Hides
Short-horizon measurement systematically understates marketing's return.
Average short-term profit ROI runs £1.87 per £1 spent, but measuring sustained effects shows the same spend returning £4.11 per £1, based on Google and WARC Effectiveness Equation work (source: Coupler.io).
Media effectiveness peaks when brand building takes 40% to 60% of total marketing investment, and one European retailer that pivoted hard to performance lost 44% of its ROI within two quarters (source: Coupler.io).
Full-funnel strategies boost overall marketing ROI by up to 45% compared with isolated bottom-funnel campaigns (source: Perion).
This is the strongest argument for treating demand generation as an ROI input rather than an unmeasurable cost center.
AI and Marketing ROI Statistics
AI now consumes a meaningful share of marketing budgets, but proof of return has moved backwards.
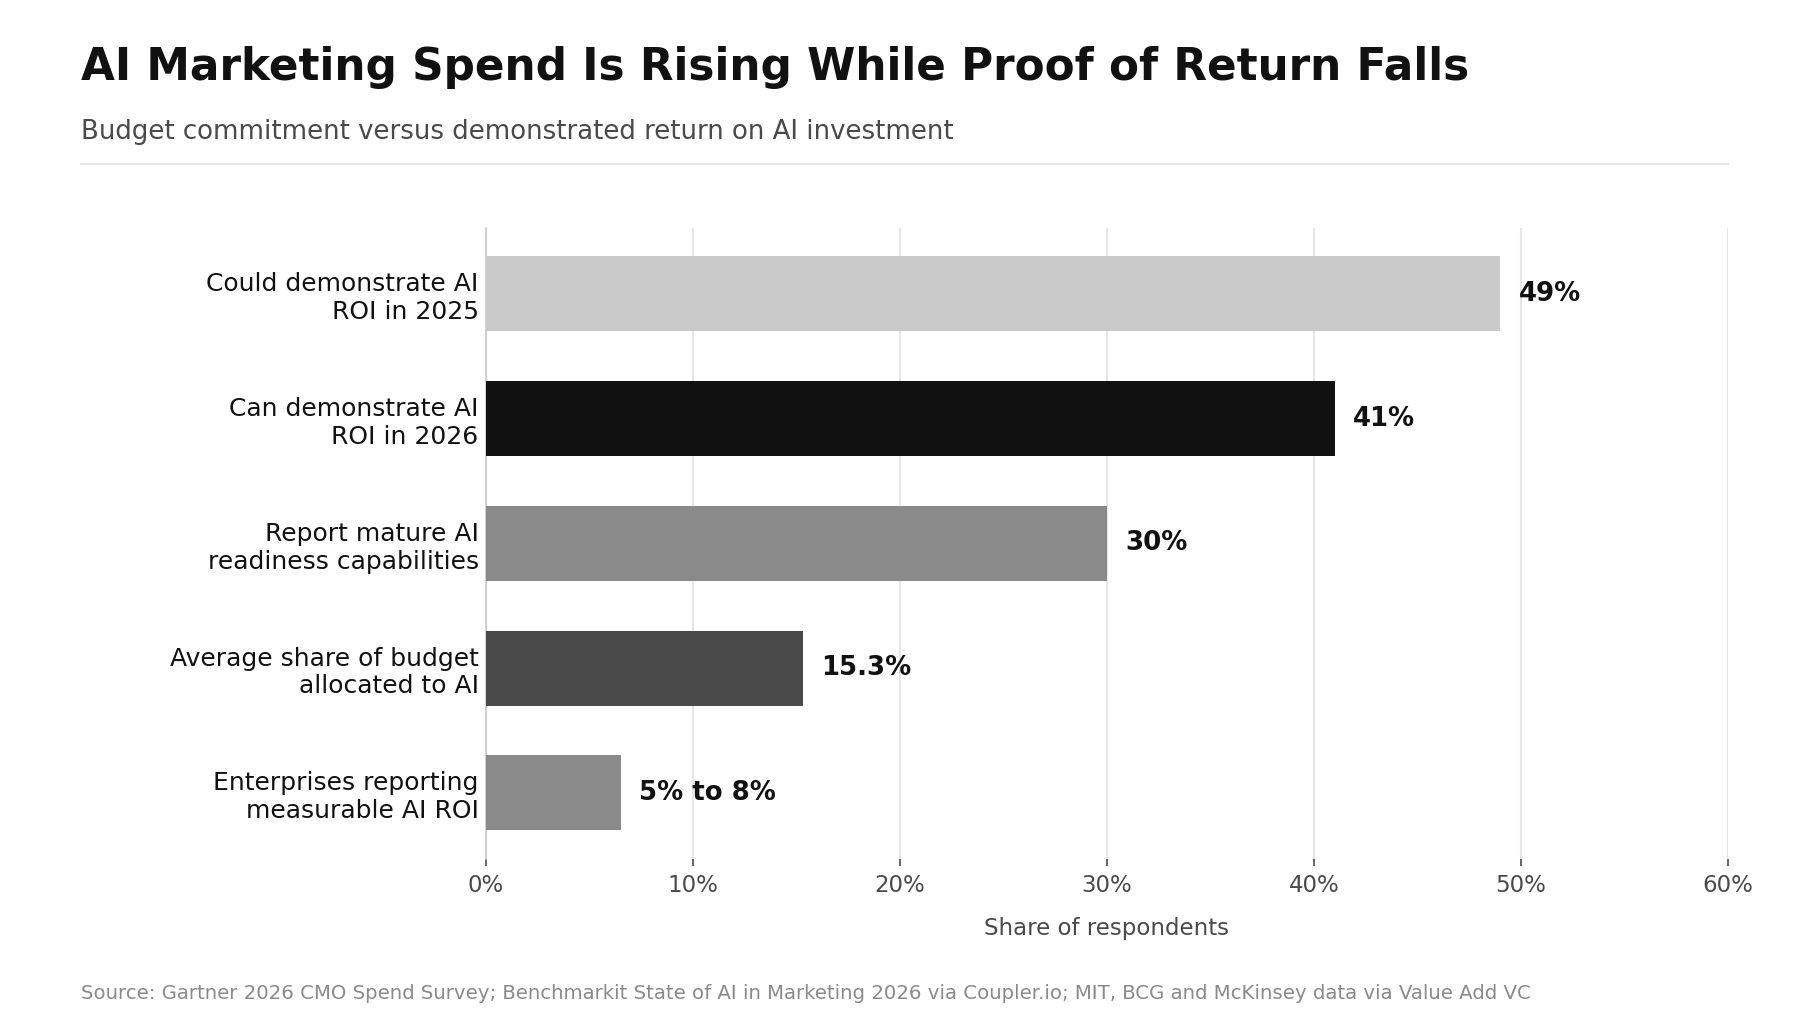
CMOs allocate an average of 15.3% of marketing budgets to AI initiatives, while 70% say becoming an AI leader is a critical goal and only 30% report mature AI readiness capabilities (source: Gartner).
Just 41% of marketers can demonstrate ROI on their AI investments in 2026, down from 49% a year earlier (source: Coupler.io).
At enterprise scale the picture is harsher: only 5% to 8% of enterprises report measurable AI ROI despite average AI budgets of $186 million and 88% adoption (source: Value Add VC).
Where AI is integrated rather than merely adopted, the returns are real.
The organizations capturing that upside look different on the balance sheet.
AI-mature organizations allocate 21.3% of marketing budgets to AI and 8.9% of total revenue to marketing, against 7.8% for all respondents, and direct 34.2% of budget toward innovation versus a 27.2% average (source: Chief Marketer).
For a framework that survives finance review, see GrowthCentr's AI ROI measurement framework, the guide to AI marketing tools and this breakdown of AI agent ROI metrics that survive a CFO review.
B2B Marketing ROI: Unit Economics Benchmarks
In B2B and SaaS, marketing ROI is expressed through acquisition efficiency rather than campaign-level return.
| Metric | 2026 benchmark |
|---|---|
| Median B2B SaaS LTV:CAC | 3.2:1 |
| Top-quartile LTV:CAC | 4:1 to 6:1 |
| Enterprise SaaS ($100K+ ACV) | 4.5:1 |
| SMB SaaS ($5K to $20K ACV) | 2.5:1 |
| Median SaaS CAC payback | 6.8 months |
| B2B CAC payback | 8.6 months |
| B2C CAC payback | 4.2 months |
The median B2B SaaS LTV:CAC ratio is 3.2:1 across an analysis of 939 companies, with top-quartile performers between 4:1 and 6:1 (source: Foundry CRO).
Median SaaS CAC payback is 6.8 months across more than 14,500 tracked companies, splitting to 8.6 months for B2B and 4.2 for B2C, and 76% of SaaS companies recover acquisition cost inside the healthy 12-month window (source: SaaS Goodies).
Acquisition is getting more expensive. SaaS companies now spend $2.00 to acquire $1.00 of new ARR, up 14% since 2023, and CAC ranges from roughly $200 on brand search to $35,000 on ABM, a spread of more than 100x by channel (source: SaaS Goodies).
Median CAC has risen 14% year over year as digital advertising costs climb and sales cycles lengthen (source: SaaS Hero).
Those numbers only hold if the inputs are right.
GrowthCentr's guides to B2B SaaS CAC benchmarks, customer lifetime value and net revenue retention cover the calculation traps, and CAC payback math covers the cash-flow side.
Measurement Method Adoption Statistics
Triangulation, not any single model, is becoming the standard, and HubSpot's survey shows why: measuring ROI is the top challenge for 33% of marketers (Source: HubSpot).
WARC describes a two-speed measurement landscape in which digital platforms embed real-time outcome-based optimization while legacy media move from audience metrics toward experiments and advanced modelling, both converging on incremental growth (source: WARC).
AI is moving measurement upstream by automating data collection, cleaning and normalisation, allowing teams to run mix models and incrementality tests far more frequently than before (source: Inside Radio).
The caveat matters as much as the trend: a better tool built on bad data simply reaches the wrong answer faster.
For the practical build, see marketing mix modeling for B2B.
How to Calculate Marketing ROI Correctly
Marketing ROI is calculated as gross profit attributable to marketing, minus marketing cost, divided by marketing cost.
ROAS is a narrower measure: revenue divided by ad spend, ignoring margin and overhead. Confusing the two is the most common reporting error in 2026.
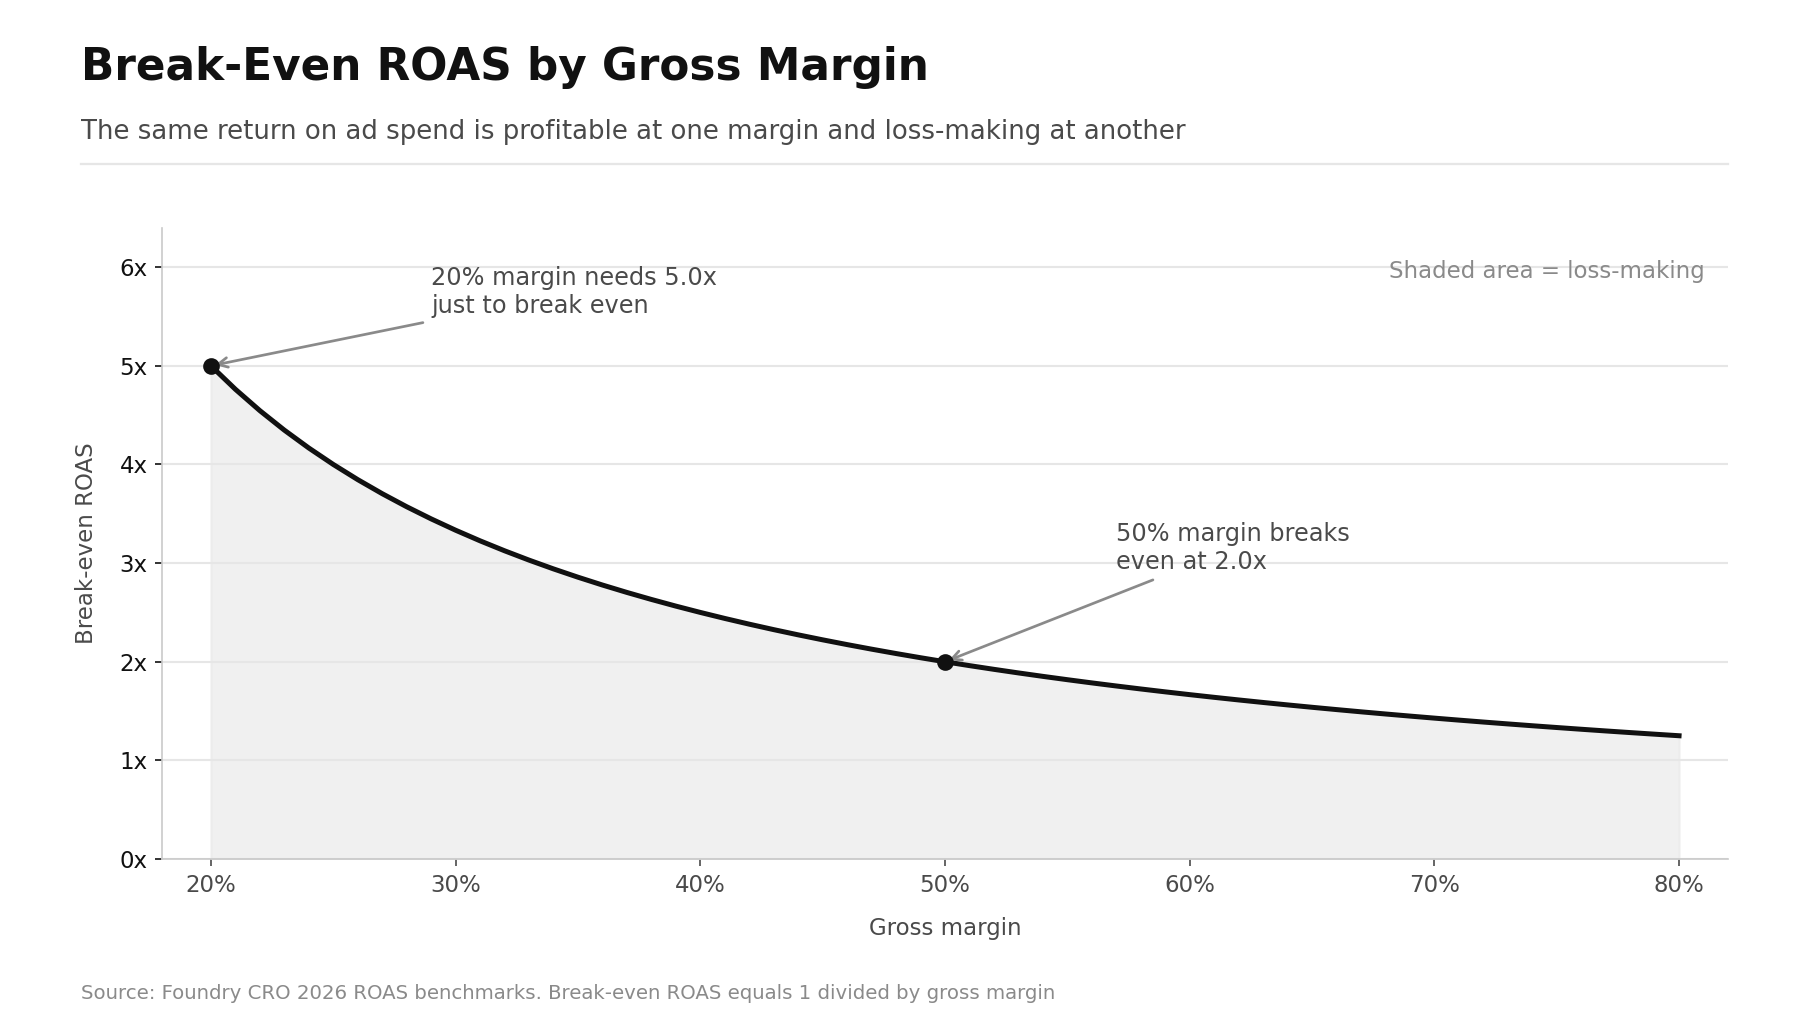
Break-even ROAS equals 1 divided by gross margin.
At a 50% margin, break-even is 2:1; at a 20% margin, it is 5:1 (source: Foundry CRO).
This is why a 2:1 return can be excellent for one business and loss-making for another, and why blended ROAS across all channels is the number that belongs in a board deck.
Conclusion
GrowthCentr exists to make marketing spend defensible, connecting channel activity to unit economics that hold up under finance review.
The 2026 data tells a consistent story: budgets are flat at 7.8% of revenue, returns have compressed roughly 10% on paid platforms, email remains the highest-return channel by a wide margin at $36 per dollar, and B2B acquisition efficiency has tightened to a 3.2:1 median LTV:CAC with 8.6-month payback.
The largest gap is not performance but proof: 85% of marketers feel confident about ROI while 32% measure it holistically, and AI spend is rising even as the share of teams able to demonstrate its return falls.
Teams that fix measurement before adding spend will own the advantage through the next planning cycle.
Read Next
FAQs
1. What is a good marketing ROI in 2026?
A good marketing ROI in 2026 depends on channel and margin, but blended returns above 3:1 are considered healthy for most businesses, with email at $36 per $1 spent and modeled search returns near $1.70 per $1 spent. Break-even ROAS equals 1 divided by gross margin, so a 50% margin business breaks even at 2:1.
2. What is the average ROI of email marketing in 2026?
The average ROI of email marketing in 2026 is $36 for every $1 spent, per Litmus; the often-quoted $42 comes from an older UK DMA study and is not directly comparable. That still makes email the highest-returning digital channel measured this year.
3. Why can't most marketers prove marketing ROI?
Most marketers cannot prove marketing ROI because measurement is fragmented rather than holistic: 85% report confidence in their ROI measurement while only 32% measure across channels, and just 33% of enterprises set formal KPI targets for marketing ROI. Separate brand and performance teams at 49% of companies compound the problem.
4. What is the difference between marketing ROI and ROAS?
The difference between marketing ROI and ROAS is scope. ROAS divides revenue by ad spend and ignores margin, salaries and tooling, while marketing ROI divides gross profit attributable to marketing, net of marketing cost, by that cost. ROAS measures campaign efficiency; ROI measures business contribution.
5. How much of revenue should a company spend on marketing in 2026?
A company should spend roughly 7.8% to 9.0% of revenue on marketing in 2026, depending on size and sector, with large enterprises averaging 7.8% per Gartner and a broader US sample averaging 9.0% per The CMO Survey. AI-mature organizations spend 8.9% or more.
Disclaimer: This content is provided for informational purposes only and does not constitute legal, financial, or compliance advice. Protocol versions, governance arrangements, and partner counts cited here reflect publicly announced milestones as of August 2026 and are moving quickly. Adoption figures come from vendor and foundation announcements with differing methodologies and should be treated as directional signals rather than guaranteed outcomes.