
Median business-to-business cost per lead climbed to $213 in 2026, up from $198 in 2025, with the gap between top-quartile and bottom-quartile programs widening to 4.7x, according to HubSpot's State of Marketing 2026 (Source: Digital Applied).
This report is a consolidated benchmark set, pulling the major 2026 lead generation datasets into one place so teams can measure their own numbers against the market rather than against anecdote.
Lead prices are rising across nearly every channel while conversion rates compress. The result is that the spread between a disciplined lead program and a careless one is now far wider than the price difference between the channels they use.
This report collects 50+ lead generation statistics for 2026 covering market size, cost per lead, conversion rates, response time, follow-up behavior, channel ROI, and AI adoption.
Key Takeaways
- Median B2B cost per lead reached $213 in 2026, up 7.6% year over year.
- Roughly 80% of leads never convert, mostly from weak qualification and follow-up.
- Median lead response time is 42 hours; only 7% answer within five minutes.
- Cost per lead spans 24x across B2B industries, from $31 to $748.
- 61% of B2B teams now use AI lead scoring, up from 23% in 2024.
The Lead Generation Market in 2026
Lead generation is now one of the largest single line items in marketing budgets, and it keeps growing.
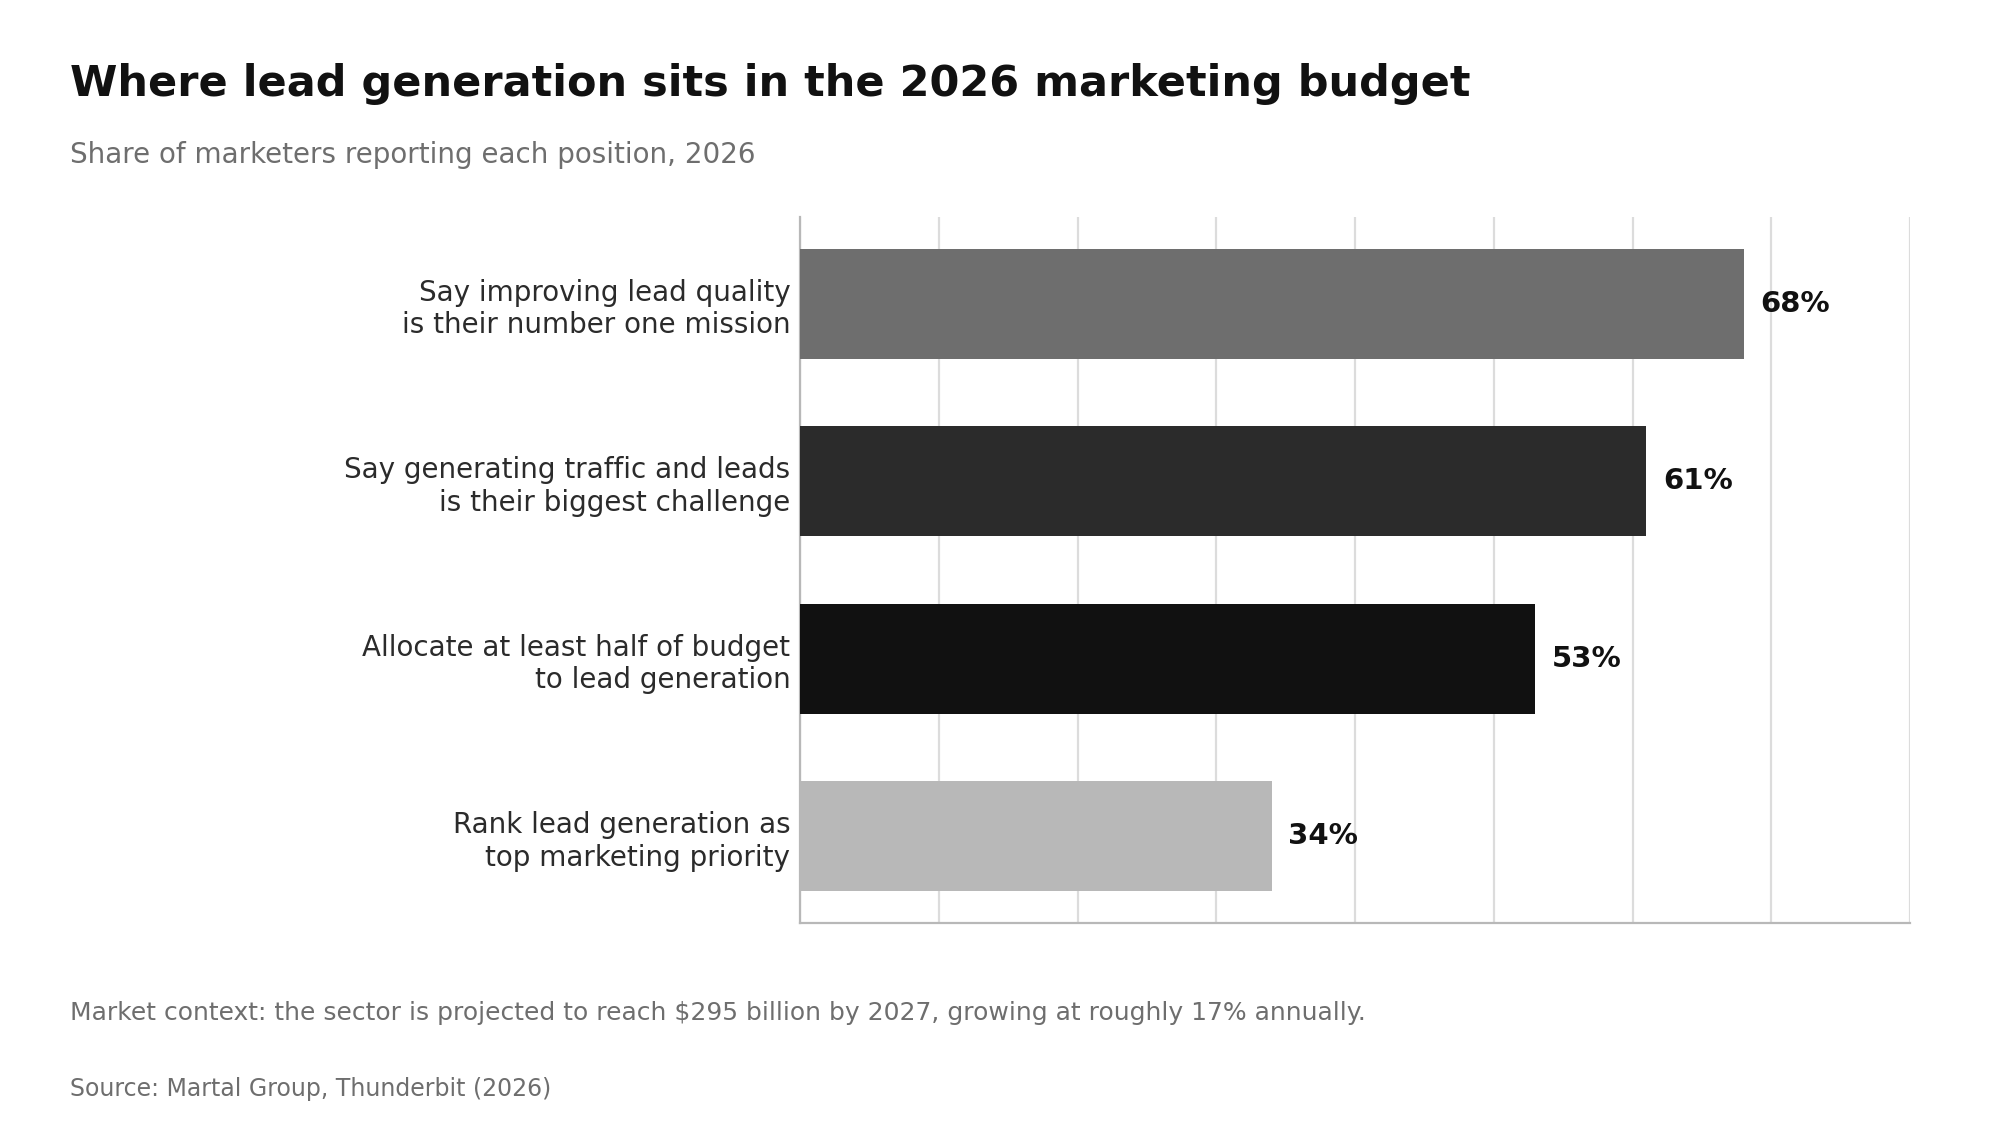
- The lead generation industry is projected to reach $295 billion by 2027, growing at roughly 17% annually (Source: Martal Group).
- 53% of marketers allocate at least half of their budget to lead generation (Source: Thunderbit).
- 34% of companies rank lead generation as their top marketing priority, and 61% say generating traffic and leads is their biggest challenge (Source: Thunderbit).
- The average organization generates about 1,877 leads per month (Source: Martal Group).
- 68% of B2B marketers say improving lead quality is their number one mission (Source: Martal Group).
The pattern is consistent across every dataset. Volume is no longer the constraint, and budget is no longer the constraint. Qualification is.
Why Cost Per Lead Keeps Rising
Acquisition costs have moved faster than most budgets. Customer acquisition costs have risen roughly 60% over the past five years (Source: Martal Group).
A Q1 2026 benchmark study covering more than 8,500 B2B and B2C companies globally put the average cost per lead across all industries at $213.60, a 7.6% year-over-year increase from $198.44 in 2025 (Source: Amra & Elma).
Three forces are driving the increase:
- Auction inflation. More advertisers competing for the same high-intent keywords.
- Privacy and signal loss. Weaker targeting means more wasted impressions per qualified lead.
- Funnel compression. Median MQL-to-SQL conversion fell from 13% in 2024 to 9.8% in 2026, a 24% decline in two years, per Forrester and Demand Gen Report data (Source: Digital Applied).
Paying more per lead while converting fewer of them is the defining economic problem of lead generation in 2026.
Cost Per Lead Benchmarks by Channel
Channel averages vary by roughly 4x before industry is even factored in.
| Channel | Average cost per lead (2026) |
|---|---|
| SEO and organic search | $34 |
| Email marketing | $58 |
| Organic social | $63 |
| Webinars | $72 |
| Paid search | $85 |
| Content marketing | $100 |
| Paid professional social | $125 |
Channel-level CPL figures are compiled from HubSpot, Demand Gen Report, LinkedIn, Gartner and Forrester research (Source: Searchlab).
- 73% of marketers say webinars produce their highest-quality leads at an average of $72 per lead (Source: Martal Group).
- Paid professional social CPL sits between $75 and $200 depending on offer type, with native lead forms converting at 13% versus 2.35% for standard landing pages (Source: Meet Lea).
The cheapest channel is rarely the cheapest cost per closed deal, which is why CPL should only ever be compared within the same offer type.
Cost Per Lead Benchmarks by Industry
Industry spread is even wider than channel spread.
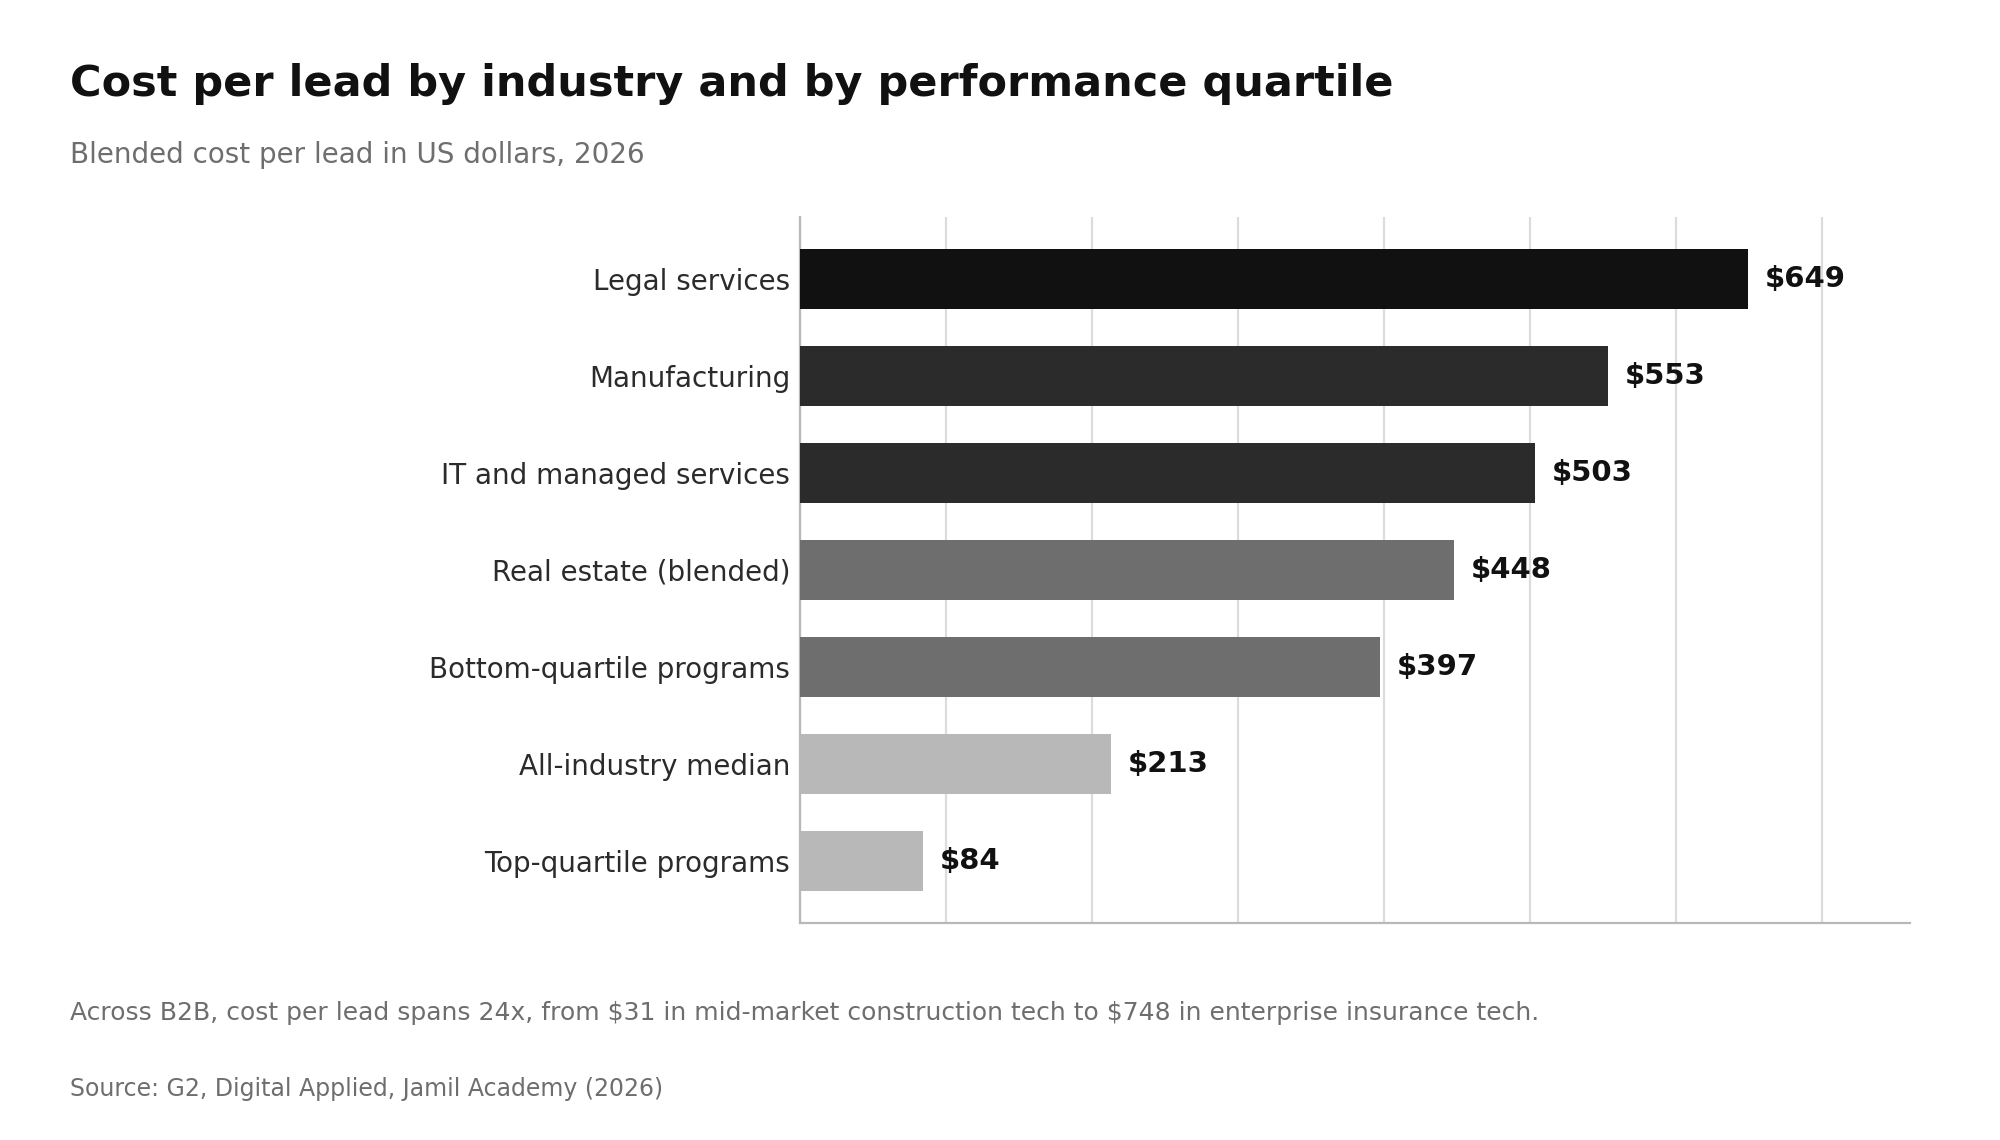
- Legal services carry a blended CPL of $649, manufacturing $553, and IT and managed services $503 (Source: G2).
- Across B2B, cost per lead spans 24x, from $31 in mid-market construction tech to $748 in enterprise insurance tech (Source: Digital Applied).
- The top quartile of programs reports CPL of $84 while the bottom quartile sits at $397 (Source: Digital Applied).
- In real estate, blended cost per lead runs $416 to $480, with paid social at $5 to $30 and seller-keyword search ads at $150 to $400 (Source: Jamil Academy).
A headline average is close to useless without industry, deal size, and intent context attached to it.
Lead Conversion Rate Statistics
Conversion is where most lead generation spend quietly disappears.
- About 79% of leads never convert into sales, usually because of weak nurturing and qualification (Source: Martal Group).
- 50% of leads are qualified but not yet ready to buy at the moment of first contact (Source: Salesgenie).
- MQL-to-SQL converts at a 13% median, with the top quartile hitting 28% (Source: Digital Applied).
- Disciplined nurturing produces 50% more sales-ready leads at 33% lower cost (Source: Martal Group).
- Only 2% of sales are made on first contact (Source: ProfitOutreach).
The top-performing quartile is not buying different traffic. It is qualifying harder before anyone spends time dialing.
Speed to Lead Statistics
Response time remains the most studied and least acted-on metric in the entire funnel.
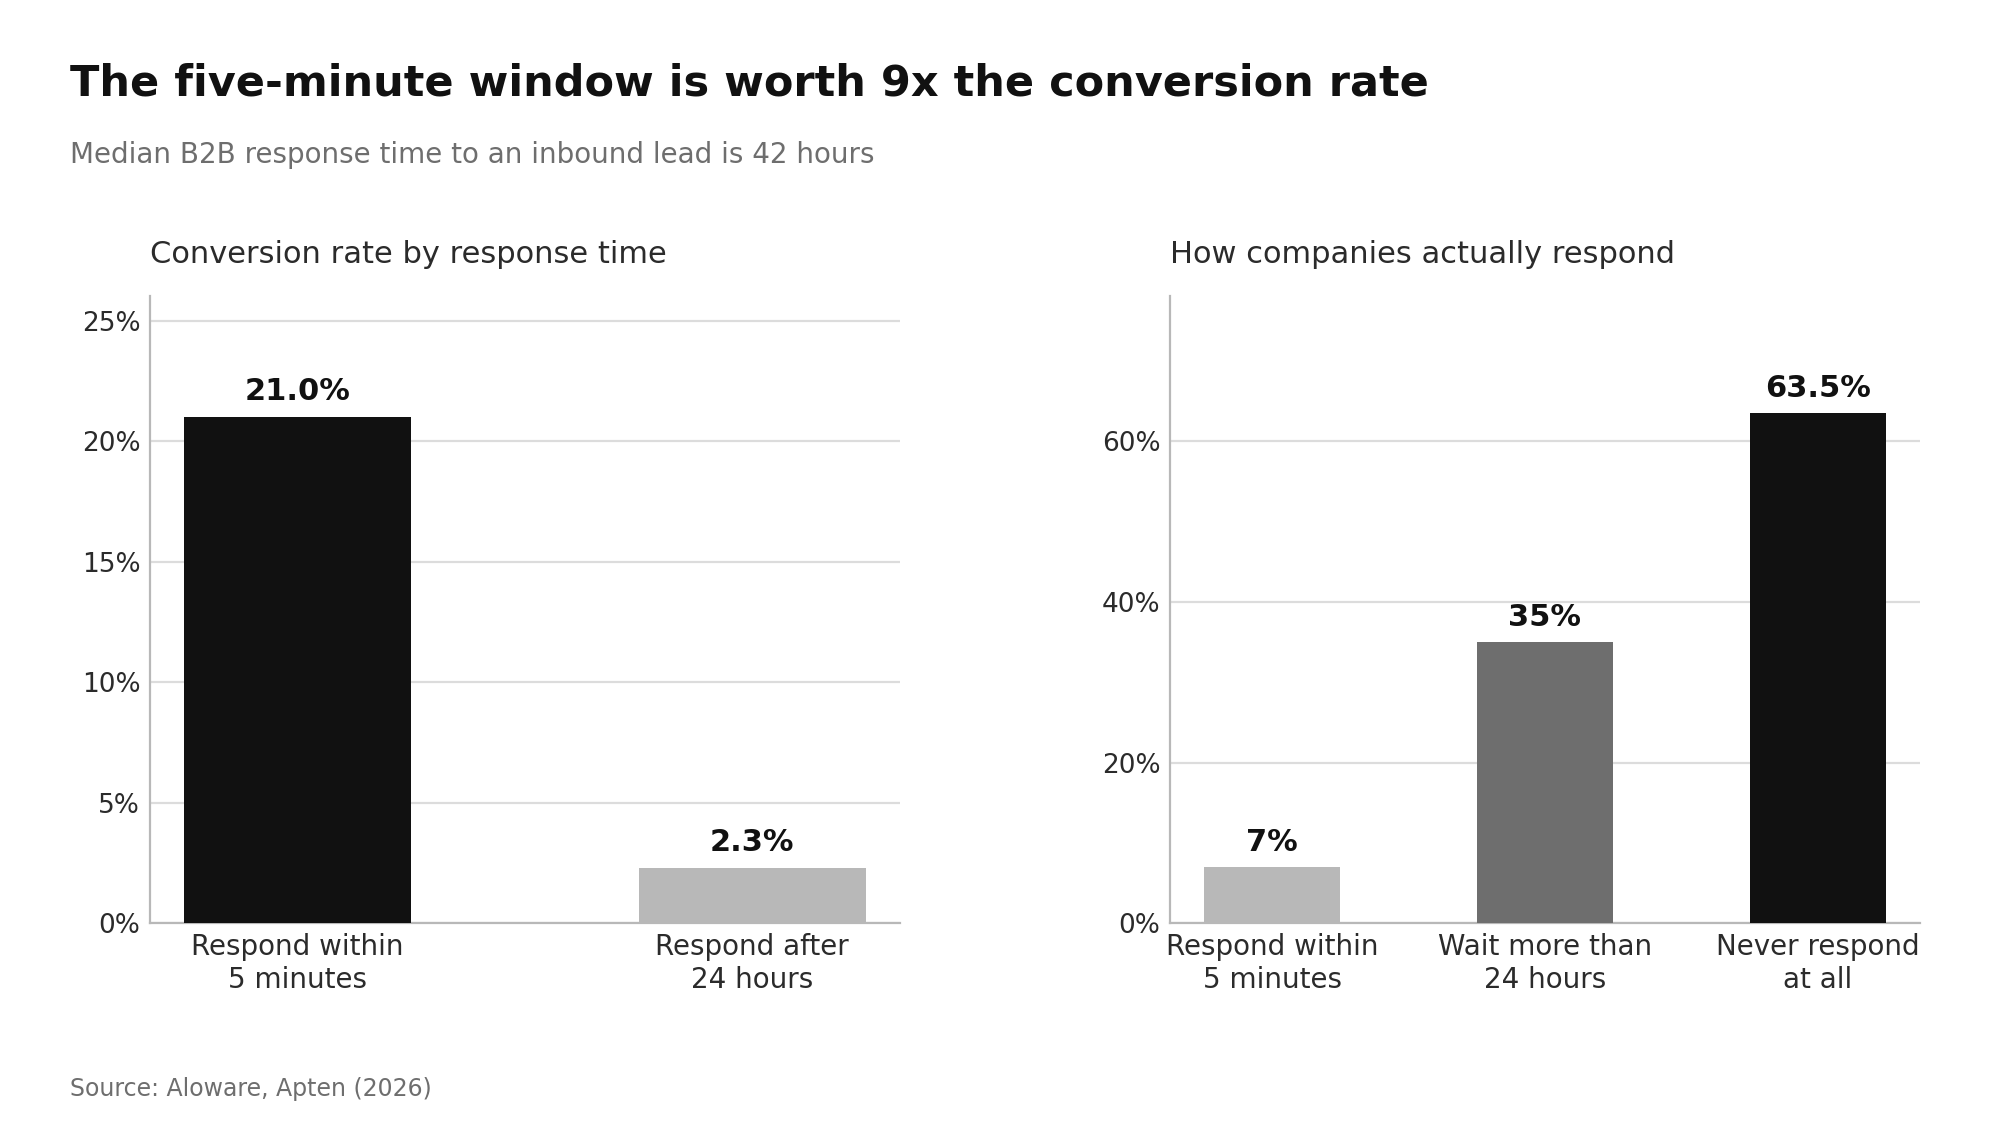
- The median B2B response time to an inbound lead is 42 hours, and roughly 35% of leads wait more than 24 hours for any response (Source: Aloware).
- Only about 7% of teams answer within five minutes, even though five-minute responders convert at roughly 21% versus 2.3% for teams that wait a day (Source: Aloware).
- Responding within five minutes makes a team 21x more likely to qualify the lead than waiting 30 minutes, per the MIT and InsideSales Lead Response Management study (Source: Aimdoc).
- A Velocify analysis of more than 3.5 million leads found that calling within one minute increases conversion by 391% compared with calling after two minutes (Source: LeadResponse).
- About 78% of buyers purchase from the first vendor that responds (Source: Aimdoc).
- InsideSales research attributes 35% to 50% of all sales to the vendor that responds first (Source: LeadResponse).
- A 2026 study of 1,000 companies found 63.5% never responded to an inbound lead at all, and those that did averaged more than 29 hours (Source: Apten).
- 81.2% of companies responding in over an hour report losing leads to faster competitors (Source: Apten).
Speed is the cheapest conversion lever available, and the overwhelming majority of the market still does not pull it.
Follow-Up and Lead Nurturing Statistics
Most leads are abandoned long before they had a fair chance to convert.
- 80% of sales require five to twelve follow-ups, yet 92% of reps quit after four attempts (Source: ProfitOutreach).
- 95% of converted leads are reached on the sixth call attempt, but only 10% of salespeople make more than three attempts (Source: ProfitOutreach).
- Sales reps make an average of just 1.3 contact attempts before moving on (Source: LeadResponse).
- Half of all leads are never called a second time, and 81% of sellers make five or fewer attempts (Source: OutSales).
- Teams with a standardized follow-up process see a 78% higher conversion rate (Source: ProfitOutreach).
- 63% of prospects who request information will not purchase for at least three months (Source: ProfitOutreach).
- A single follow-up email lifted reply rates by 65.8% across a 12 million email study, and spacing messages three days apart raised replies a further 31% (Source: OutSales).
- An average of 21 outreach attempts per contact is now reported across nurture programs (Source: Salesgenie).
The follow-up gap is the largest unpriced asset in lead generation. Buying better leads and then quitting after two calls reproduces the same outcome as buying bad ones.
Channel Performance and ROI Statistics
Cost per lead is only half the equation. Return per channel is where the real dispersion shows up.
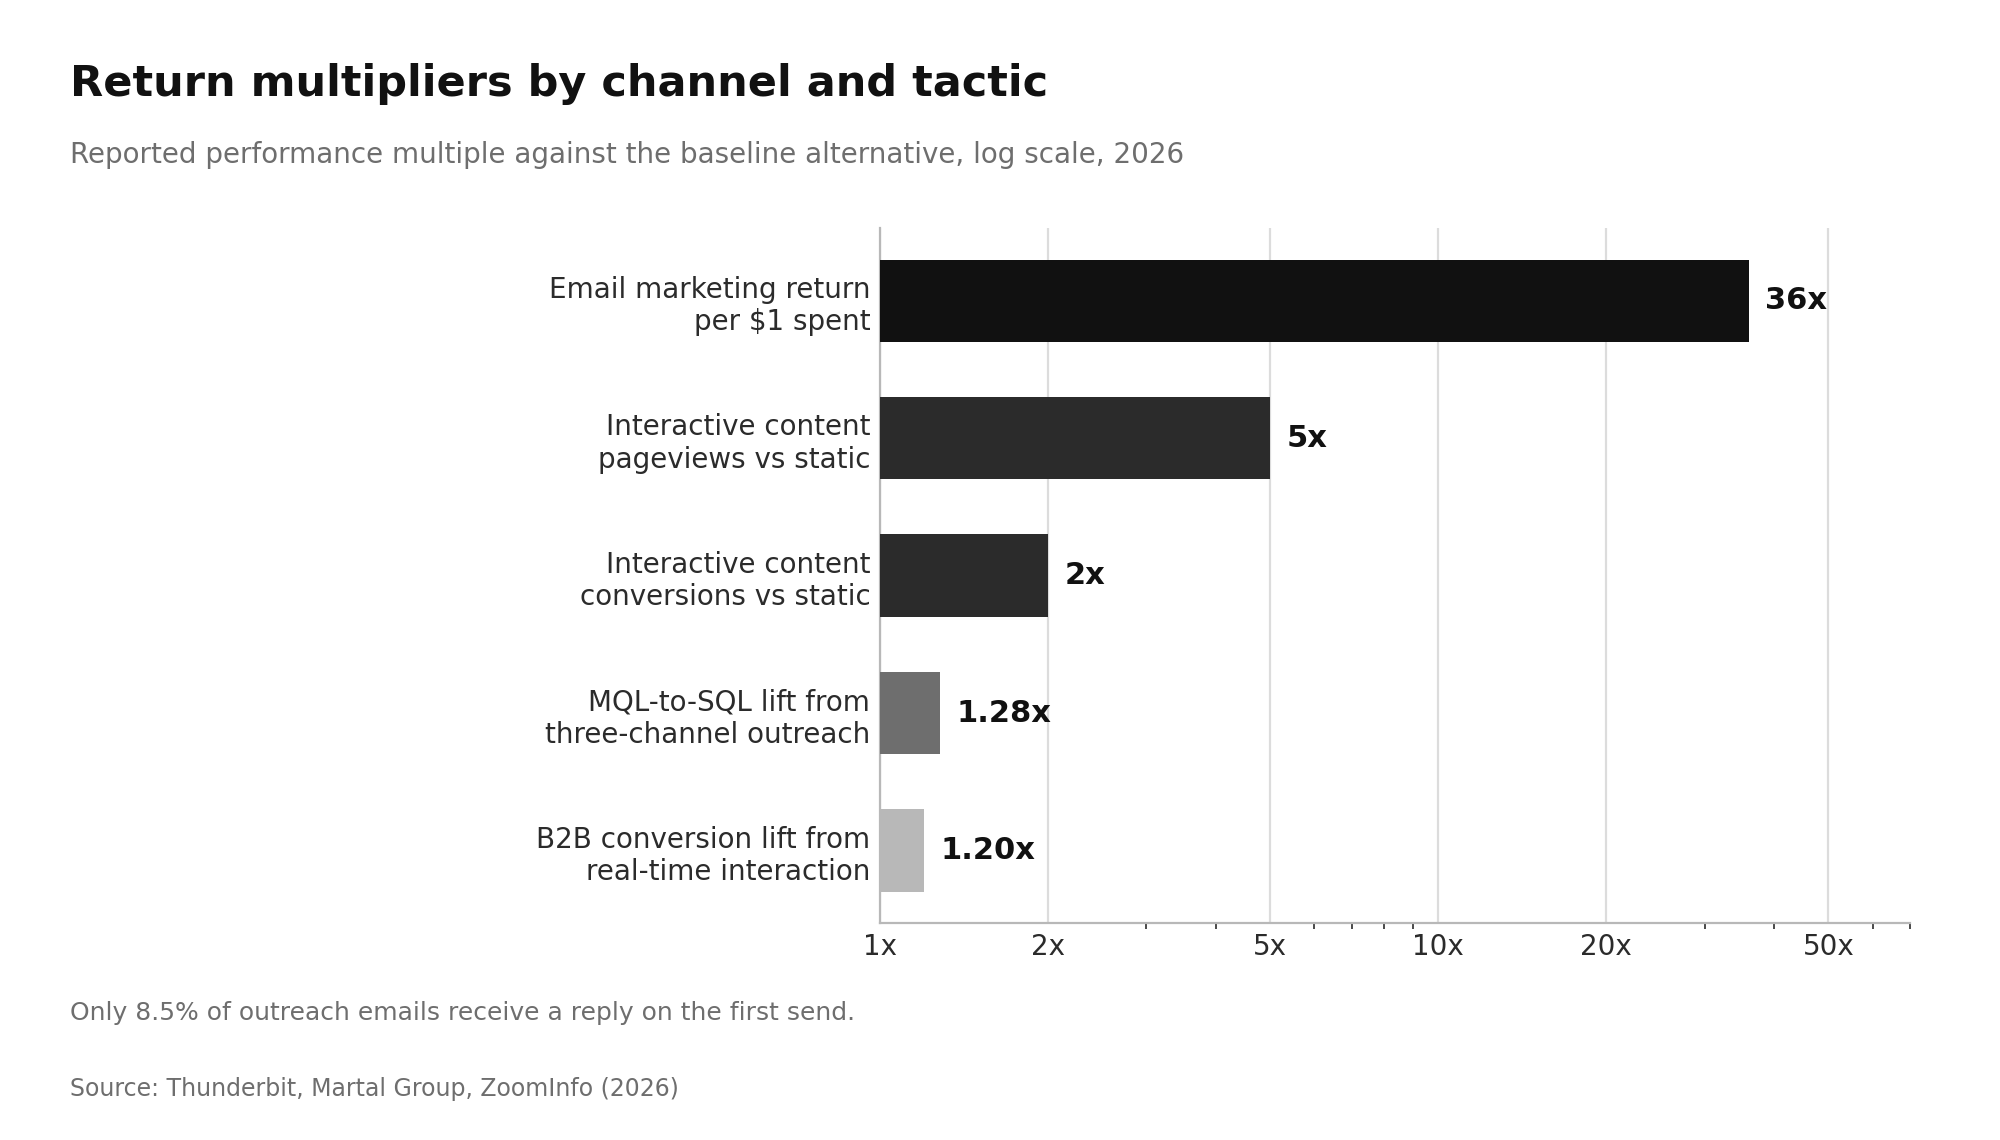
- Email marketing delivers an average return of $36 for every $1 spent (Source: Thunderbit).
- Interactive content generates 2x more conversions and 5x more pageviews than static content (Source: Martal Group).
- Real-time interaction has lifted B2B conversion rates by up to 20% (Source: Martal Group).
- Teams using a triple-touch approach across phone, email and social see 28% higher MQL-to-SQL rates than two-channel teams (Source: ZoomInfo).
- Only 8.5% of outreach emails receive a reply on the first send (Source: ZoomInfo).
- 40% of marketers cite measuring and proving ROI as a top challenge, and 46% of growth-mode marketers rank ROI as the most effective KPI (Source: G2).
Channel selection matters less than channel discipline. The same channel produces top-quartile and bottom-quartile results depending on qualification and cadence.
AI in Lead Generation: Adoption and Performance
AI moved from experiment to default infrastructure between 2024 and 2026.
- 61% of B2B teams now use AI for lead scoring, up from 23% in 2024 (Source: Digital Applied).
- 64% of businesses using AI chatbots report an increase in qualified leads (Source: Martal Group).
- AI-enabled lead routing reduces response time by 80% on average, and companies using AI for lead prioritization see 35% higher conversion on hot leads (Source: GreetNow).
AI Search as a Lead Source
AI assistants have become a small but disproportionately valuable acquisition channel.
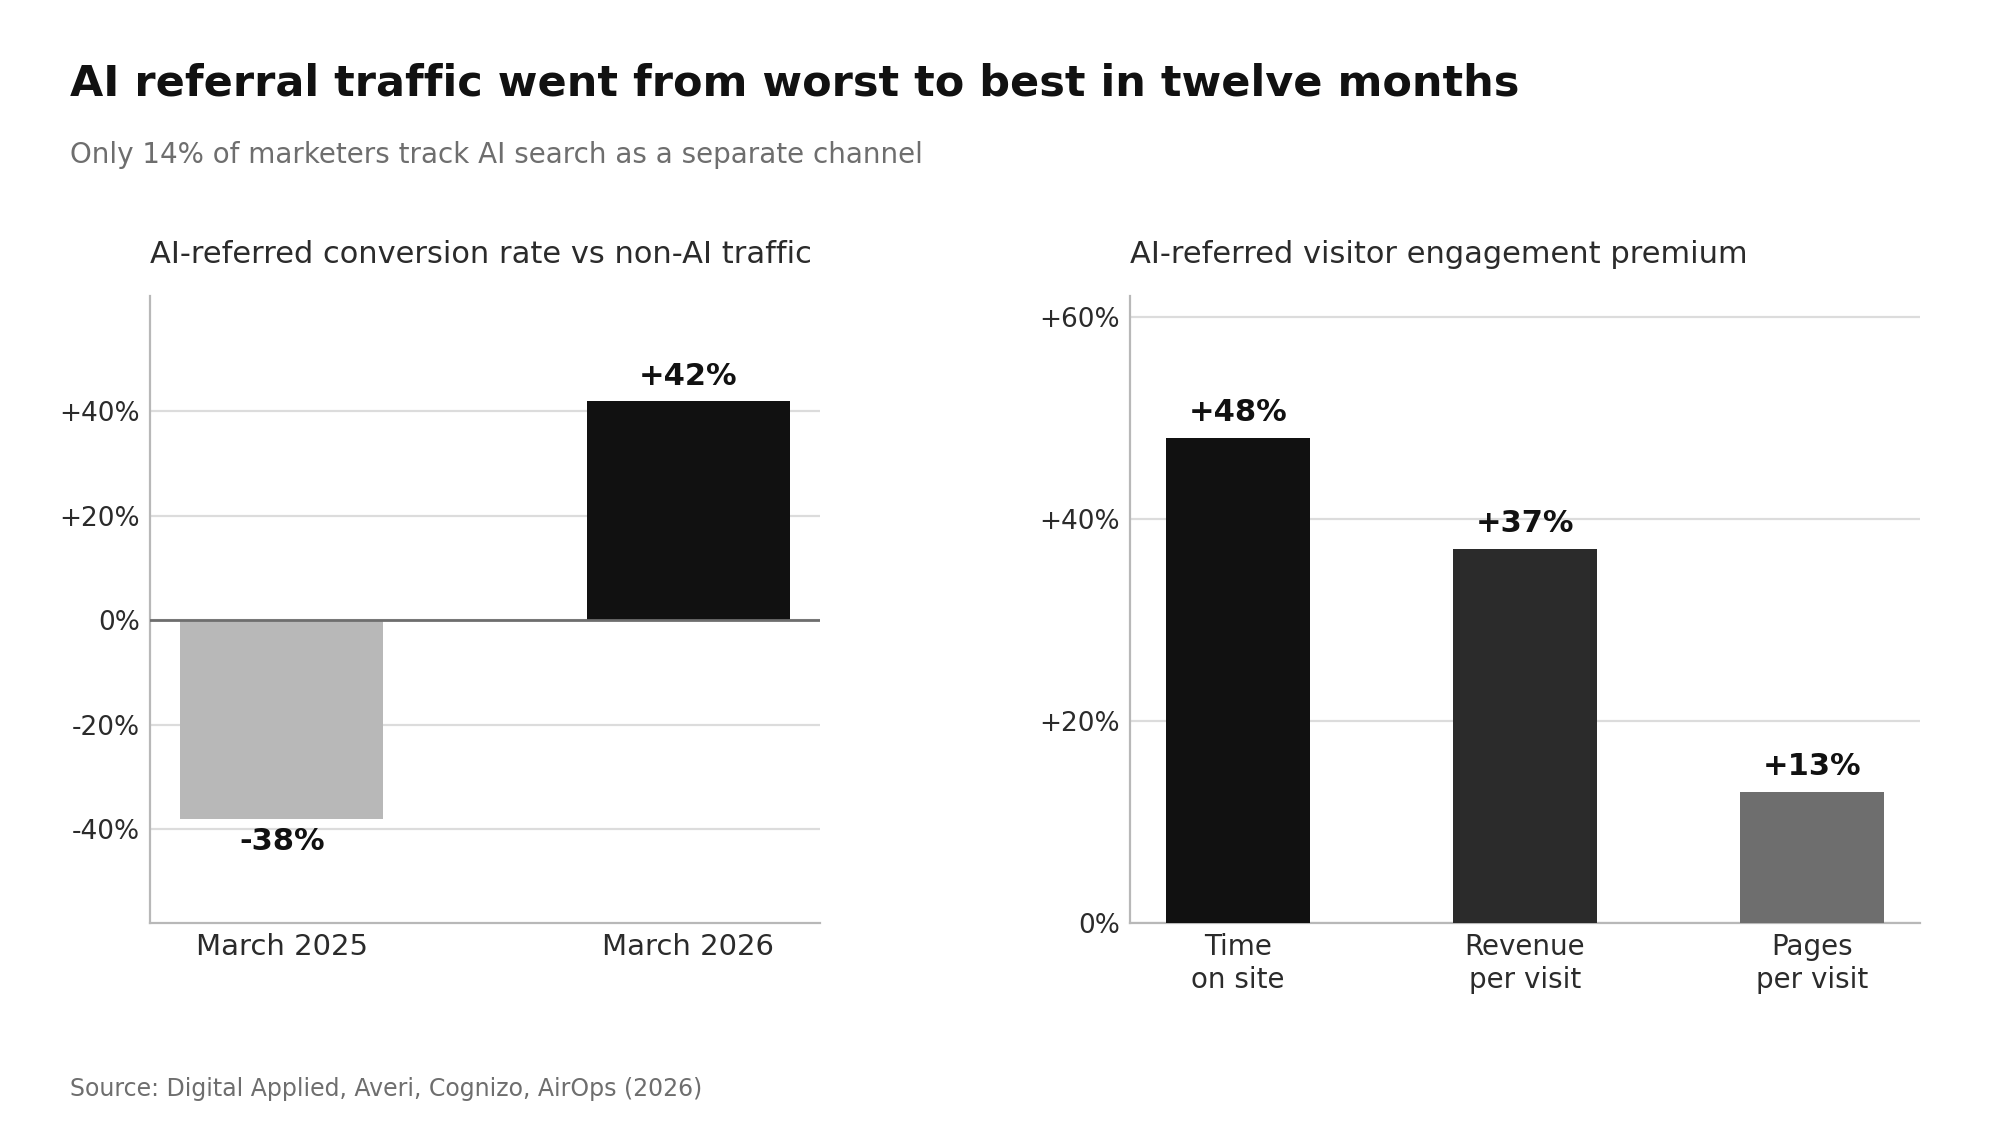
- In March 2026, visitors arriving from AI assistants converted 42% better than non-AI traffic, reversing a position twelve months earlier when the same channel converted 38% worse (Source: Digital Applied).
- Cross-industry 2026 data puts AI-driven visitors at 4.4x the conversion rate of standard organic search (Source: Averi).
- AI-referred visitors also spent 48% more time on site, viewed 13% more pages, and generated 37% higher revenue per visit (Source: Cognizo).
- Only 14% of marketers track AI search as a separate channel, and only 30% of brands stay visible across AI answers consistently (Source: AirOps).
- AI-generated answer panels now appear in roughly one in four searches (Source: Omnibound).
The volume is still small relative to organic search, but the conversion quality gap makes it the highest-value untracked source in most analytics setups.
What the 2026 Data Means for Marketing Teams
Read together, the statistics above support four operating decisions.
- Stop optimizing for CPL alone. With a 24x industry spread and a 4.7x spread inside the same industry, cost per closed deal is the only comparable metric.
- Score before you spend time. With MQL-to-SQL down to 9.8%, prioritization is worth more than incremental volume.
- Fix response time before increasing budget. A team sitting at the 42-hour median is losing leads to structure, not to lead quality.
- Build cadences for five-plus touches. Most conversions happen well past the point where the average rep has already stopped.
How to Benchmark Your Own Lead Generation Numbers
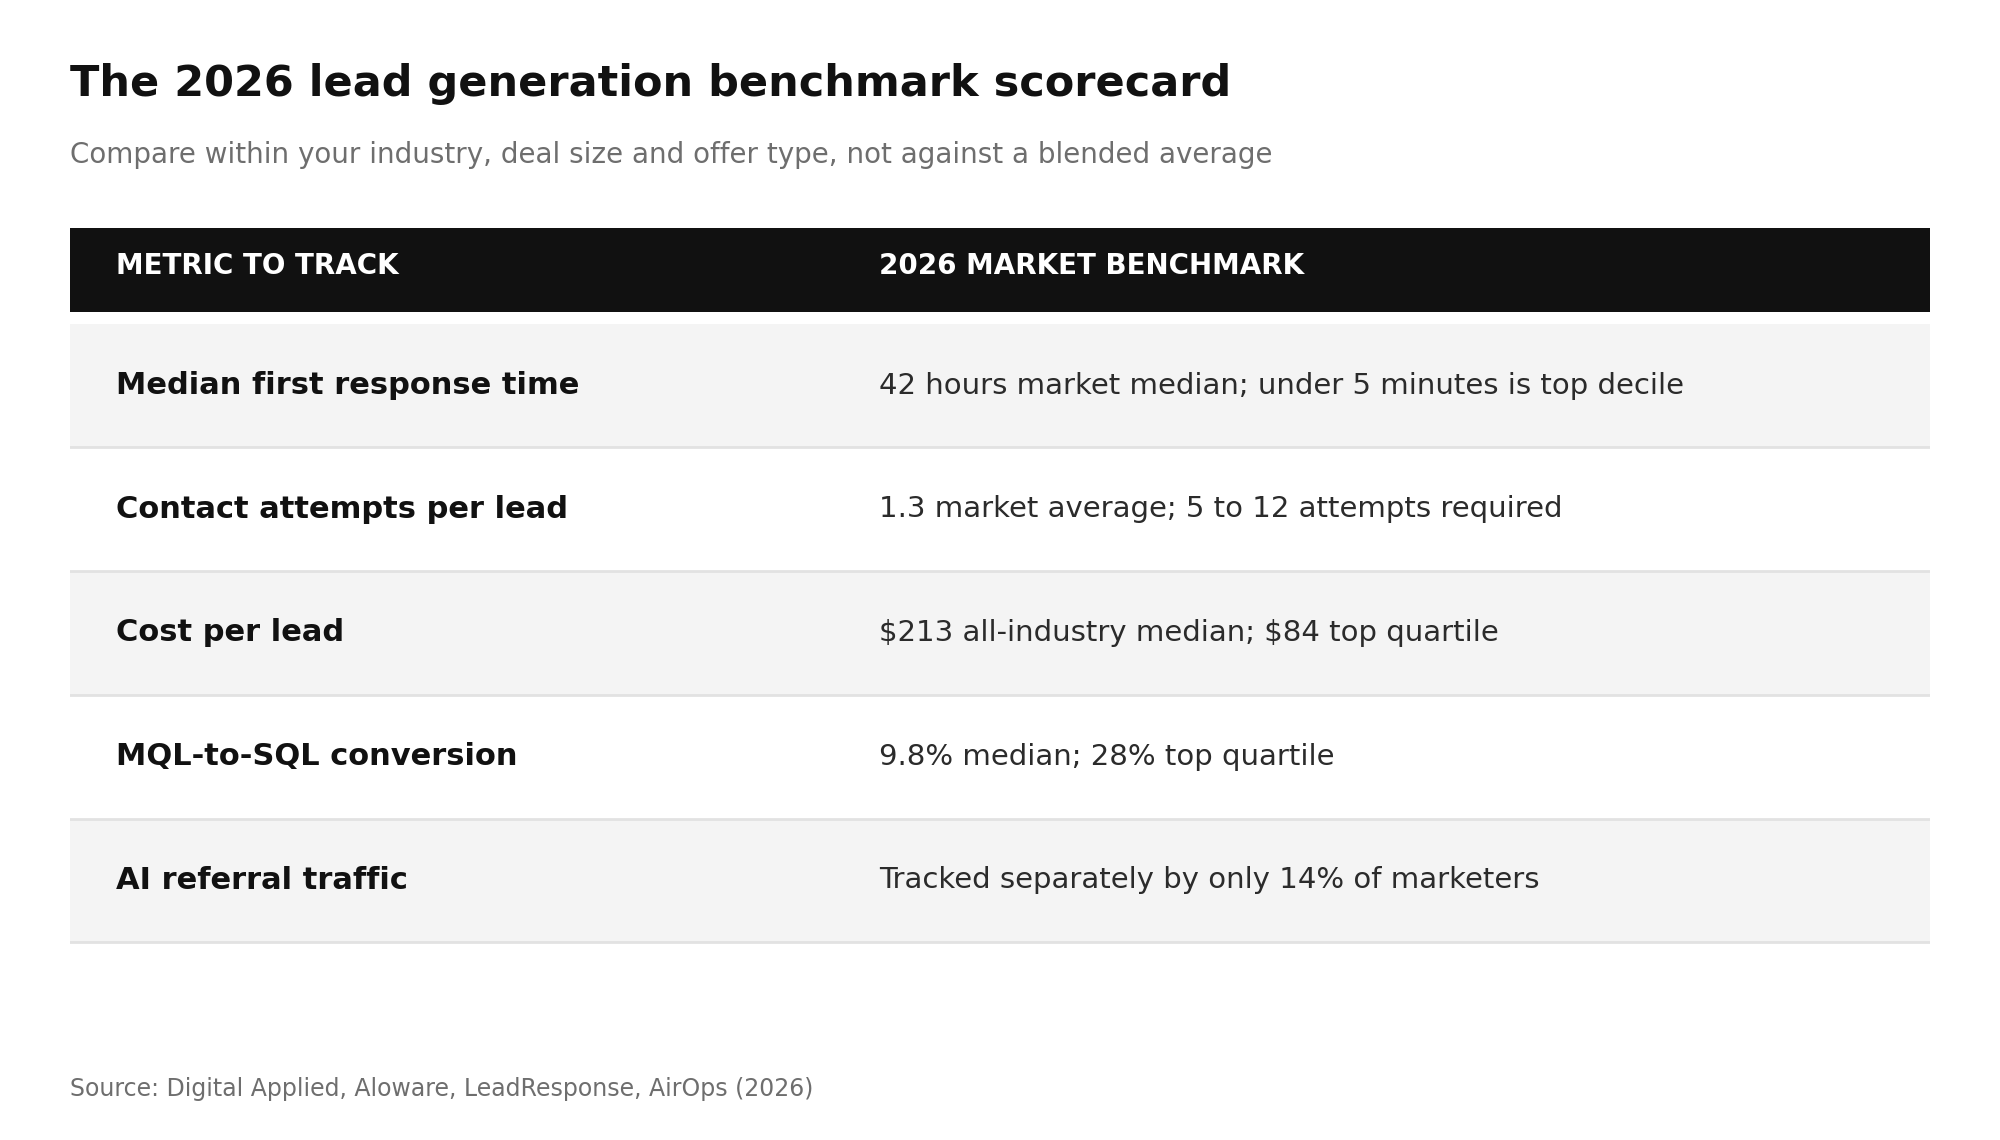
Use these five metrics rather than the vanity ones.
- Cost per closed deal. Total channel spend divided by closed transactions, not by leads captured.
- Median first response time. Measure the median, not the average, since a handful of instant replies hides a long tail.
- Contact attempts per lead. If your average sits near the industry 1.3, the problem is process.
- Conversion rate by source and by lead grade. Segment before you judge a channel.
- AI referral traffic as its own channel. Most teams currently bury it under direct or other.
Benchmarking against a blended national average is the most common mistake. Compare within your industry, your deal size, and your offer type, or the comparison produces false confidence.
Conclusion
This report consolidates the 2026 lead generation benchmarks that matter most, drawn from HubSpot, Forrester, Adobe, Demand Gen Report, MIT and InsideSales research, Velocify, and multi-thousand company panel studies.
The data tells one story from several directions.
Leads cost more, convert less, and reward speed and persistence more than at any point in the last five years, which means the advantage now sits with teams that qualify harder, respond faster, and follow up longer than the market average.
Teams that measure themselves against these numbers rather than against last quarter will find their gaps quickly, because in almost every dataset above the failure point is process, not budget.
Read Next:
- SaaS Churn Rate Benchmarks 2026: What's a Good Rate by Segment
- What Is Account-Based Marketing (ABM)? Definition, Tiers, and When It Beats Broad Demand Gen
- What Is Demand Generation vs Lead Generation? Definition, Metrics, and How They Work Together
FAQs
1. What is the average cost per lead in 2026?
The average cost per lead in 2026 is approximately $213 across industries, up 7.6% from $198 in 2025. Channel averages range from $34 for SEO and organic search to $125 or more for paid professional social.
2. How many leads never convert into sales?
Roughly 79% to 80% of leads never convert into sales, primarily due to weak qualification and inconsistent follow-up rather than poor lead sourcing.
3. Why does speed to lead matter for conversion rates?
Speed to lead matters for conversion rates because responding within five minutes makes a team 21x more likely to qualify a lead than waiting 30 minutes, and about 78% of buyers purchase from the first vendor that responds.
4. How many follow-ups does a typical sale require in 2026?
A typical sale in 2026 requires five to twelve follow-ups, yet 92% of sales reps stop after four attempts and the average rep makes only 1.3 contact attempts per lead.
5. Is AI lead scoring worth adopting in 2026?
Yes. AI lead scoring is worth adopting in 2026, with 61% of B2B teams now using it, up from 23% in 2024, and companies applying AI prioritization reporting 35% higher conversion on hot leads.
Disclaimer:
This content is provided for informational purposes only and does not constitute legal, financial, or compliance advice. Protocol versions, governance arrangements, and partner counts cited here reflect publicly announced milestones as of August 2026 and are moving quickly. Adoption figures come from vendor and foundation announcements with differing methodologies and should be treated as directional signals rather than guaranteed outcomes.