
The median B2B SaaS company now takes 16 months to recover the cost of acquiring a single customer, while top-quartile operators do it in under 6, according to full-year actuals from 342 SaaS and AI-native software companies (Source: Aleph).
GrowthCentr tracks the unit economics behind modern go-to-market, publishing benchmark reports that help revenue teams price, budget, and forecast against real market data instead of anecdote.
Customer acquisition cost, or CAC, has become the metric that decides which growth plans get funded and which get cut, because it sits at the intersection of media inflation, sales headcount, conversion efficiency, and retention.
The problem is that almost no two companies calculate it the same way, which makes benchmarking difficult without segmented data.
This report breaks down the customer acquisition cost statistics that matter in 2026, covering benchmarks by industry, channel, business model, company stage, and payback period, along with the cost inputs and efficiency levers behind each number.
Last updated: October 2026
Related GrowthCentr cluster: agentic payments statistics, ChatGPT Instant Checkout fees (archived), product feed optimization for AI shopping agents, and Google Gemini statistics 2026. For the discovery-first merchant path after Instant Checkout, see how to sell on ChatGPT in 2026.
Key Takeaways
- Median B2B SaaS CAC payback sits at 15 to 16 months in 2026.
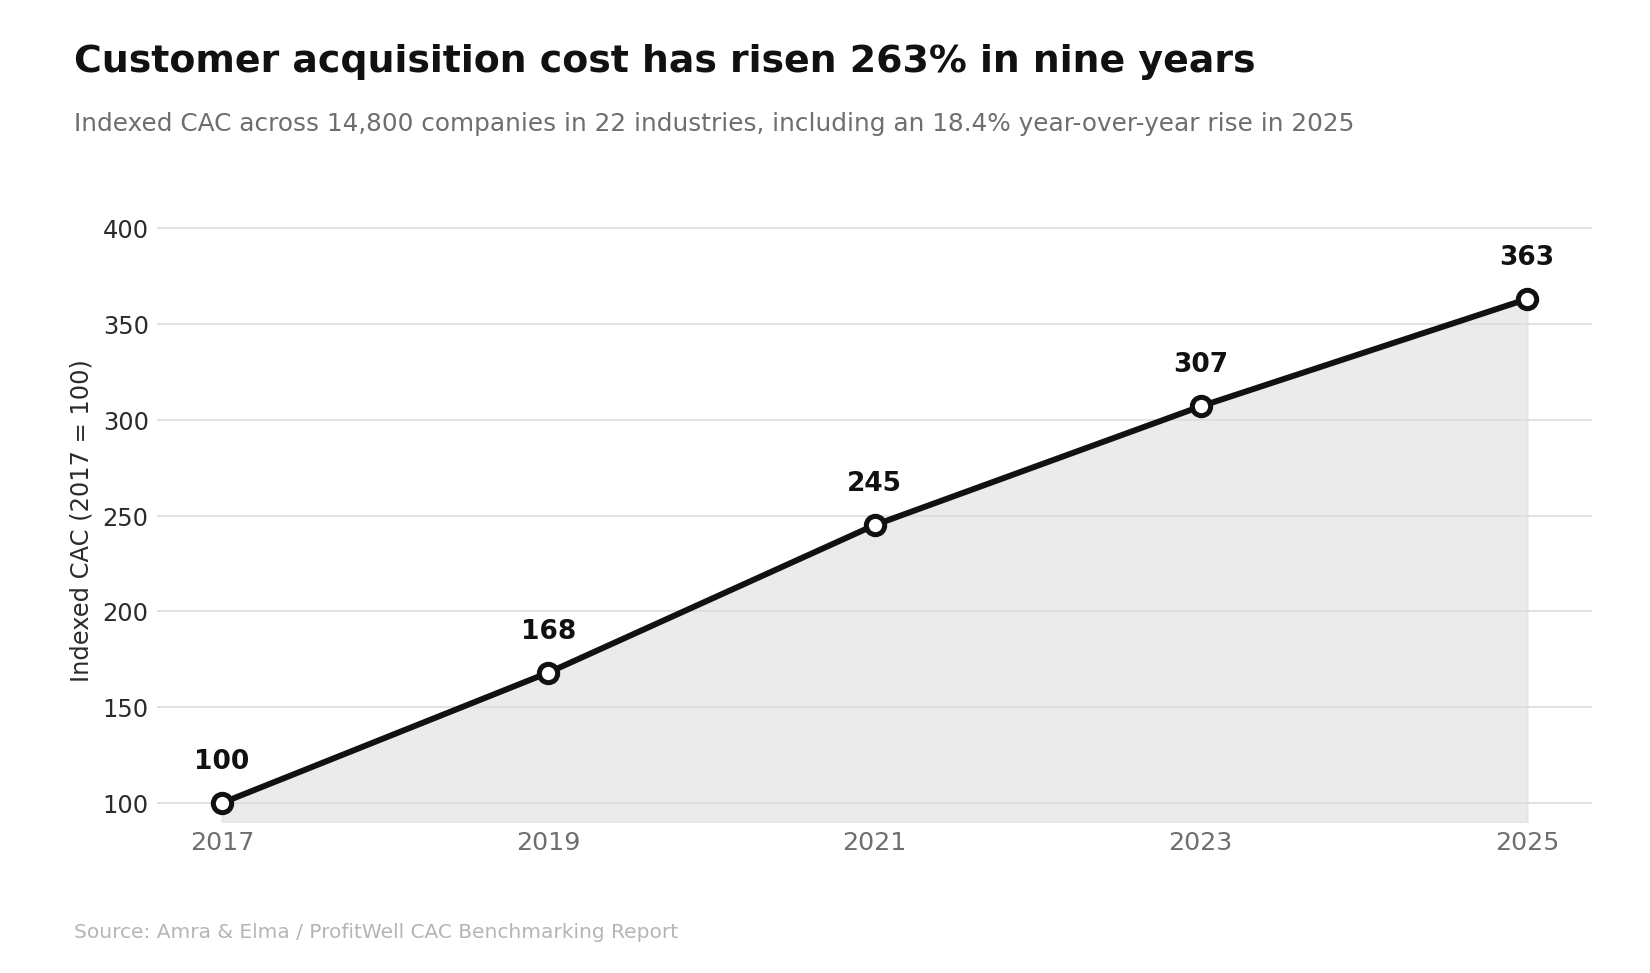
- CAC has risen roughly 260% over nine years across industries (Source: Amra & Elma).
- Organic CAC averages $942 versus $1,907 for paid acquisition.
- A 3:1 LTV to CAC ratio remains the baseline health benchmark.
- Enterprise CAC runs roughly 16 times higher than product-led CAC.
The State of Acquisition Spending in 2026
Acquisition budgets are under more scrutiny than at any point in the past decade, and the numbers explain why.
The median SaaS company now spends about $2.00 in sales and marketing to acquire $1 of new annual recurring revenue, a figure that climbed 14% from 2023 levels (Source: LTV CAC Book).
That inflation is broad rather than isolated. Analysis of marketing efficiency data across sectors found CAC increased roughly 60% over five years industry-wide, affecting businesses in every category rather than a handful of overheated verticals (Source: Genesys Growth).
The compounding effect is significant. Benchmarking data covering 14,800 companies across 22 industries in North America, Europe, and Asia-Pacific recorded a further 18.4% year-over-year rise in 2025, bringing the compounded increase to 263% over nine years (Source: Amra & Elma).
For context on how these costs fit into broader budget planning, see our breakdown of marketing ROI statistics and the wider view of where CMO budgets are going in 2026.
Why CAC Keeps Rising
Four forces show up repeatedly in the data:
- Auction inflation. Cost per lead on Google Ads climbed to $70.11, a 5.13% year-over-year increase, with B2B paid search CAC averaging $802 per customer (Source: Data-Mania).
Our Google Ads statistics report covers the auction dynamics in more detail, alongside current Google Ads CPC benchmarks.
- Signal loss. Only about 25% of iOS users opted in to app tracking following ATT, which degraded targeting precision and forced heavier spend to reach the same qualified audience (Source: Ringly).
- Buying committee expansion. More stakeholders means more touches, longer cycles, and higher cost per closed account. Enterprise procurement cycles in software now average 8.7 months (Source: Amra & Elma).
The mechanics of selling to a group are covered well in this analysis of the 16-person buying committee.
- Data infrastructure gaps. Companies with mature first-party data ecosystems, clean CRM records, and identity resolution reported 34% lower average CAC than peers still relying on third-party cookie targeting and open-auction programmatic buying (Source: Amra & Elma).
Customer Acquisition Cost Statistics by Segment
Segment is the single strongest predictor of CAC. Averages across all of SaaS are close to meaningless.
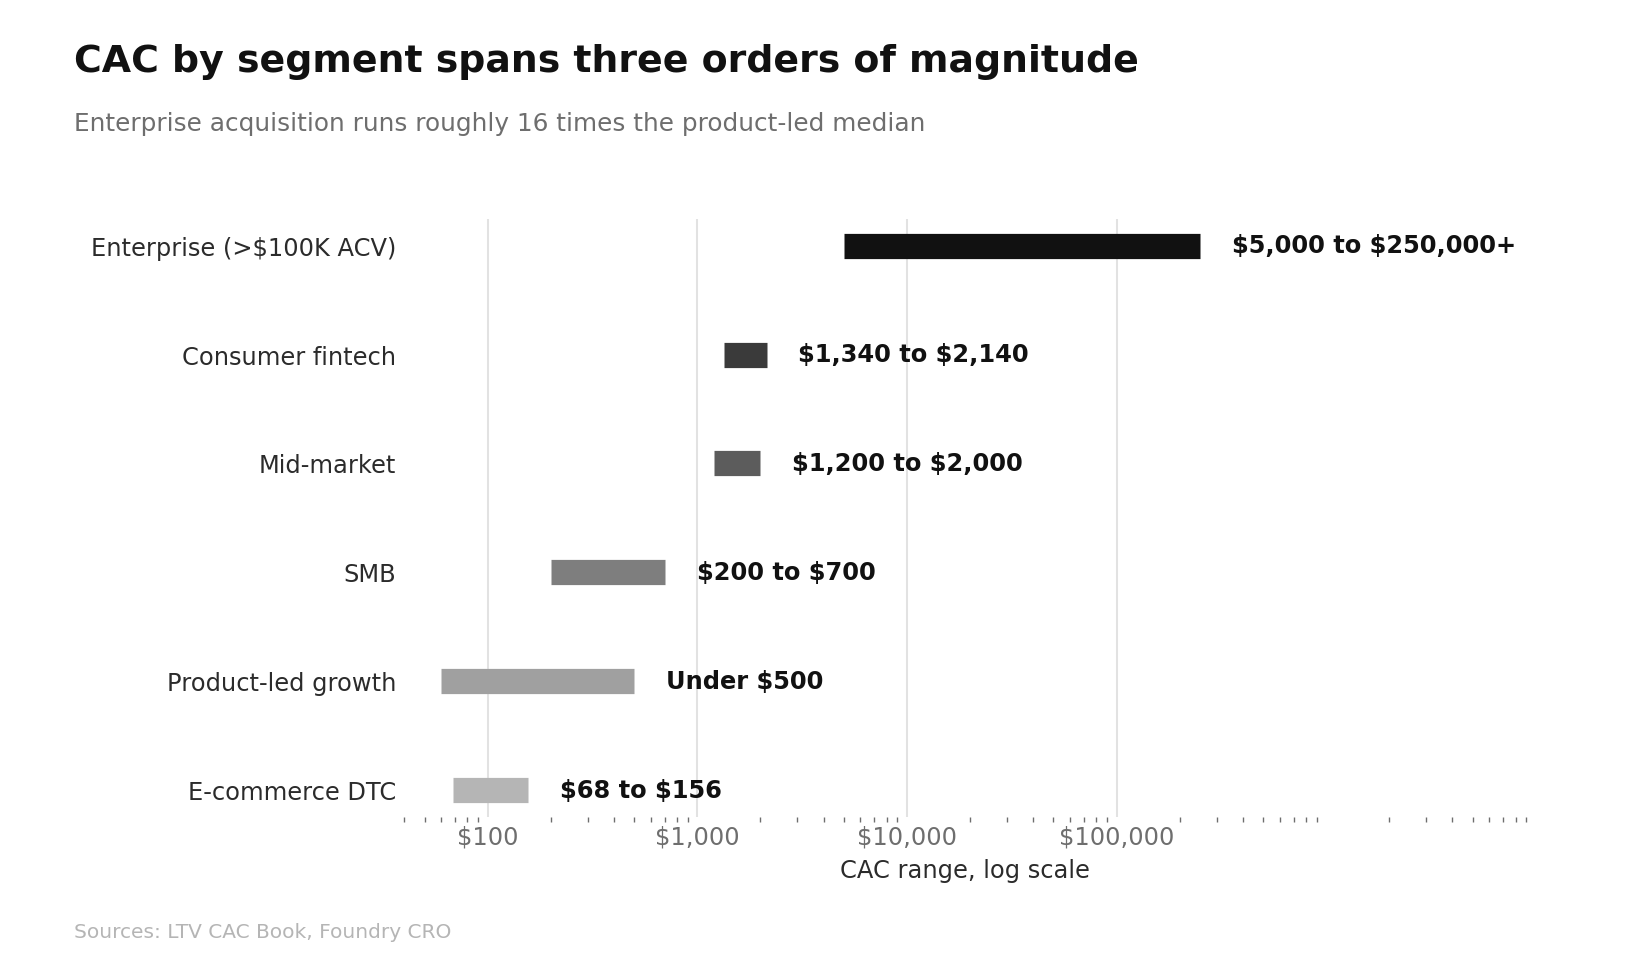
| Segment | Typical CAC range |
|---|---|
| Product-led growth | Under $500 |
| SMB | $200 to $700 |
| Mid-market | $1,200 to $2,000 |
| Enterprise (>$100K ACV) | $5,000 to $250,000+ |
| E-commerce DTC | $68 to $156 |
| Consumer fintech | $1,340 to $2,140 |
Source: LTV CAC Book
The spread between motions is stark. Enterprise CAC at $11,400 runs roughly 16 times the product-led median, which is why go-to-market motion, not industry, is usually the first variable to control for (Source: Foundry CRO).
If you are weighing motions, the comparison of PLG versus sales-led versus hybrid is a useful companion, as is our primer on product-led growth.
CAC Benchmarks by Industry
Industry-level numbers vary by an order of magnitude.
- Average B2B SaaS CAC sits at $341, while legal services can exceed $1,245 (Source: Scrap.io).
- Consumer-focused SaaS carries the lowest CAC, with e-commerce at $64 and retail at $76 (Source: Userpilot).
- Average project management software CAC rose from $891 to $1,020, a 14.5% increase, with enterprise-focused vendors spending $3,870 per closed account, mid-market at $1,340, and SMB platforms at $490 (Source: Amra & Elma).
- Reported averages span roughly $21 for e-commerce DTC brands to over $1,450 for enterprise B2B SaaS (Source: CO Consulting).
- B2B average customer lifetime value stands at $32,414 versus $10,089 for B2C, which is the denominator behind most ratio comparisons (Source: CO Consulting).
Cross-reference these against average marketing budget by industry to understand how much of total spend acquisition actually absorbs.
CAC by Acquisition Channel
Channel mix drives more CAC variance than most teams assume.
| Channel | Typical CAC |
|---|---|
| Referral | $15 to $50 |
| Organic search | $70 to $120 |
| Content marketing | ~$92 |
| Email (cold outreach) | $85 to $150 |
| Affiliate | $100 to $200 |
| Paid social | $150 to $300 |
| Paid search | $200 to $350 |
| Display | $300 to $500 |
Source: GrowSurf
At the B2B level, the organic versus paid gap is roughly two to one: organic CAC averages $942 against $1,907 for paid, drawn from a dataset covering about 120 firms (Source: CO Consulting).
Referral remains the most efficient channel but is volume-constrained, generating only 5% to 20% of total customer acquisition (Source: Userpilot).
Partner-sourced customers cost $141 to $200, deliver 16% higher lifetime value, and are 4 times more likely to refer others, yet only 8% of seed-stage companies use partnerships as a top channel compared with 41% of public companies (Source: LTV CAC Book).
Organic channel costs are rising too, though for a different reason. SEO average CAC increased from $1,185 in 2024 to $1,260 in 2026, reflecting heavier investment in premium content and technical work rather than channel decay (Source: Focus Digital).
Our lead generation statistics and LinkedIn marketing statistics reports cover top-of-funnel performance by channel in more depth.
CAC Payback Period Statistics
Payback period is where CAC becomes a financing question rather than a marketing one.
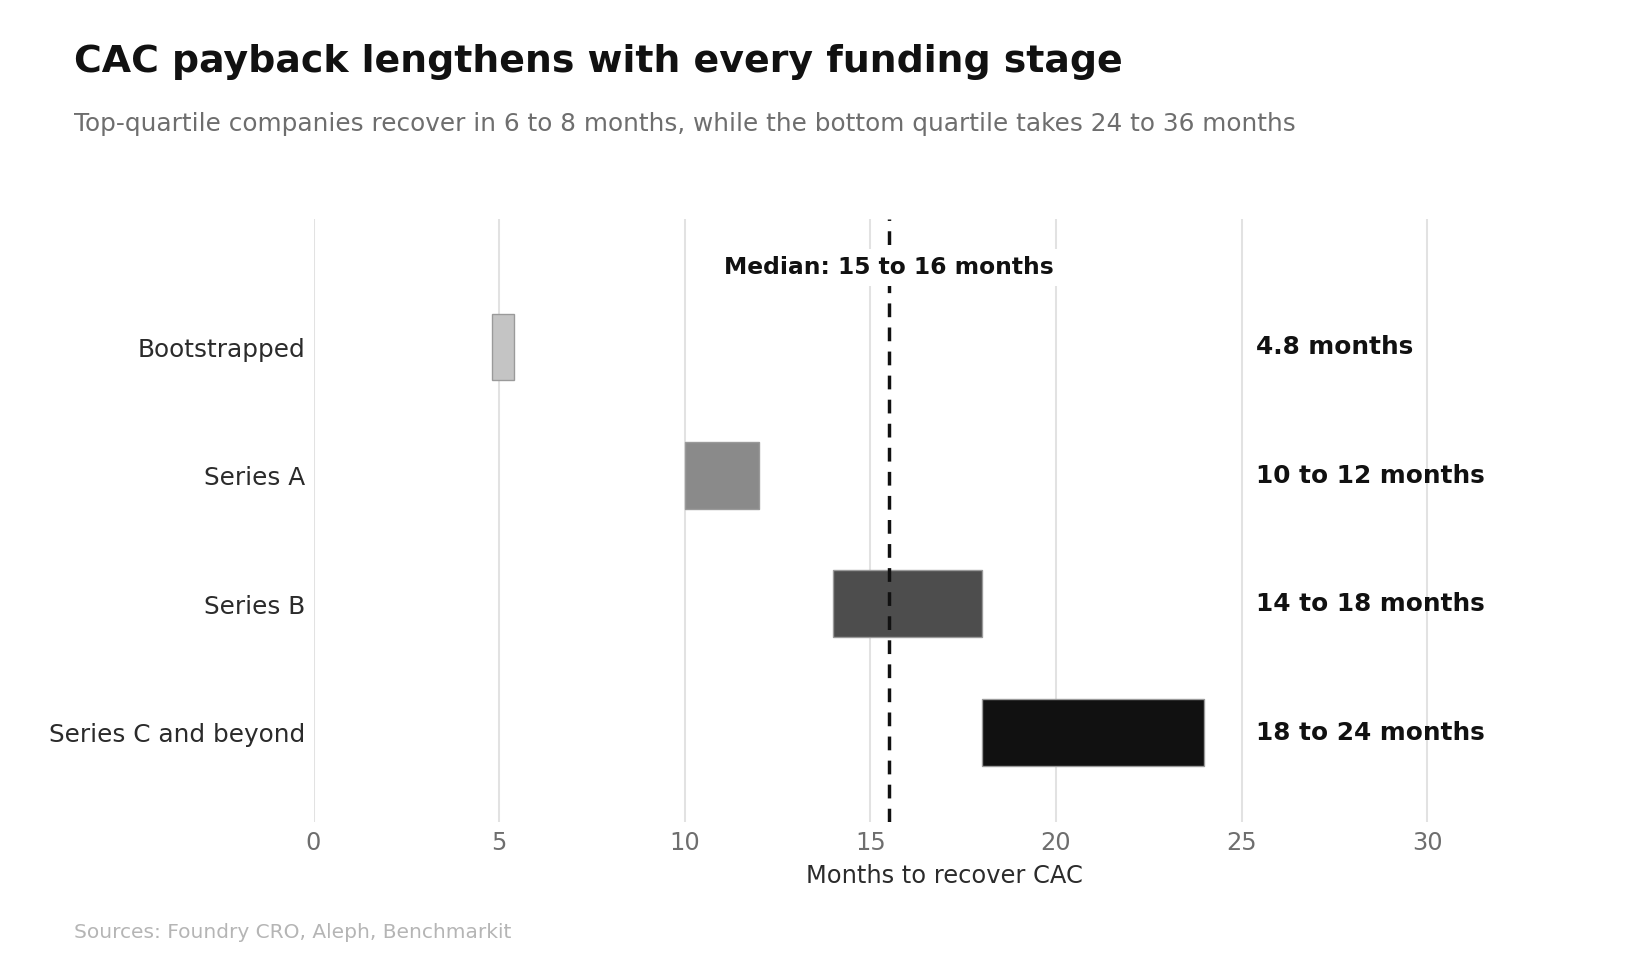
- Median B2B SaaS payback is 15 to 16 months in 2026, with top quartile at 6 to 8 months and bottom quartile stretching to 24 to 36 months (Source: Foundry CRO).
- By stage: bootstrapped 4.8 months, Series A 10 to 12 months, Series B 14 to 18 months, Series C and beyond 18 to 24 months (Source: Foundry CRO).
- By deal size: sub-$5K ACV recovers in 11 months at the median, while $50K to $100K ACV enterprise deals take 22 months (Source: Aleph).
- By segment: SMB under $15K ACV runs 8 to 12 months, mid-market 14 to 18 months, and enterprise above $100K ACV 18 to 24 months, based on 939 companies with unit economics data (Source: Optifai).
- B2C SaaS recovers far faster, averaging 4.2 months against a 15-month B2B median (Source: Artisan Strategies).
- Marketing SaaS leads verticals at a 7.8-month median payback, while HR platforms average 10.6 months (Source: Artisan Strategies).
The drift over time matters. Mid-market SaaS at $5M to $25M ARR ran a 15-month median payback in 2023; the same tier runs 18 months in 2026 (Source: Foundry CRO).
For the underlying math and the common calculation traps, see this breakdown of CAC payback in B2B SaaS, and our own B2B SaaS CAC benchmarks.
LTV to CAC Ratio Benchmarks
A 3:1 ratio remains the standard health threshold, meaning every $1 spent on acquisition should return $3 in lifetime revenue (Source: Userpilot).
Investor expectations sit higher.
Many SaaS investors look for 3:1 to 5:1, and anything at or below 2:1 usually signals unprofitable acquisition spend (Source: CO Consulting). Many B2B SaaS companies target 4:1 to 7:1 for durable profitability (Source: Data-Mania).
Ratios are only as good as the lifetime value estimate feeding them, which is why our guides to customer lifetime value and SaaS churn rate benchmarks matter as much as the CAC figure itself.
The Headcount Cost Inside CAC
Sales headcount is the largest hidden line item in most CAC calculations, and it is consistently underestimated.
The fully loaded cost of a US SDR sits at approximately $134,000 for a mid-level hire in a major city, broken into $75,000 base salary, $25,000 OTE commission at full attainment, $21,000 in employer taxes and benefits, $8,500 in tools, and $4,500 in onboarding and training. Public base salary figures understate the true cost by roughly 78% (Source: Alba Talent SDR benchmarks).
Public base salary figures understate the true cost by roughly 78% (Source: Alba Talent).
Ranges vary by market and structure. Fully loaded SDR cost runs $98,000 to $173,000 per year once benefits, tools, management overhead, and ramp are included, against a median base of $55,000 to $60,000 (Source: Salesmotion).
Other 2026 modeling puts the fully loaded band at $116,500 to $210,000 (Source: SalesHive).
Churn in the role compounds the cost. Median SDR tenure is 1.9 years with annual turnover of 34% to 40%, and the productivity plateau typically hits at 15 months (Source: Salesmotion).
Internal promotion rates fell from 34% in 2020 to 16% in 2024 (Source: Salesmotion).
For full compensation modeling, see current B2B SDR cost benchmarks and SaaS marketing budget data.
How AI Is Reshaping Acquisition Costs
AI-referred commerce also moves CAC math when checkout sits inside assistants. GrowthCentr's agentic payments statistics and the archived Instant Checkout fee teardown show why feed quality and merchant-owned checkout now matter more than in-chat platform fees.
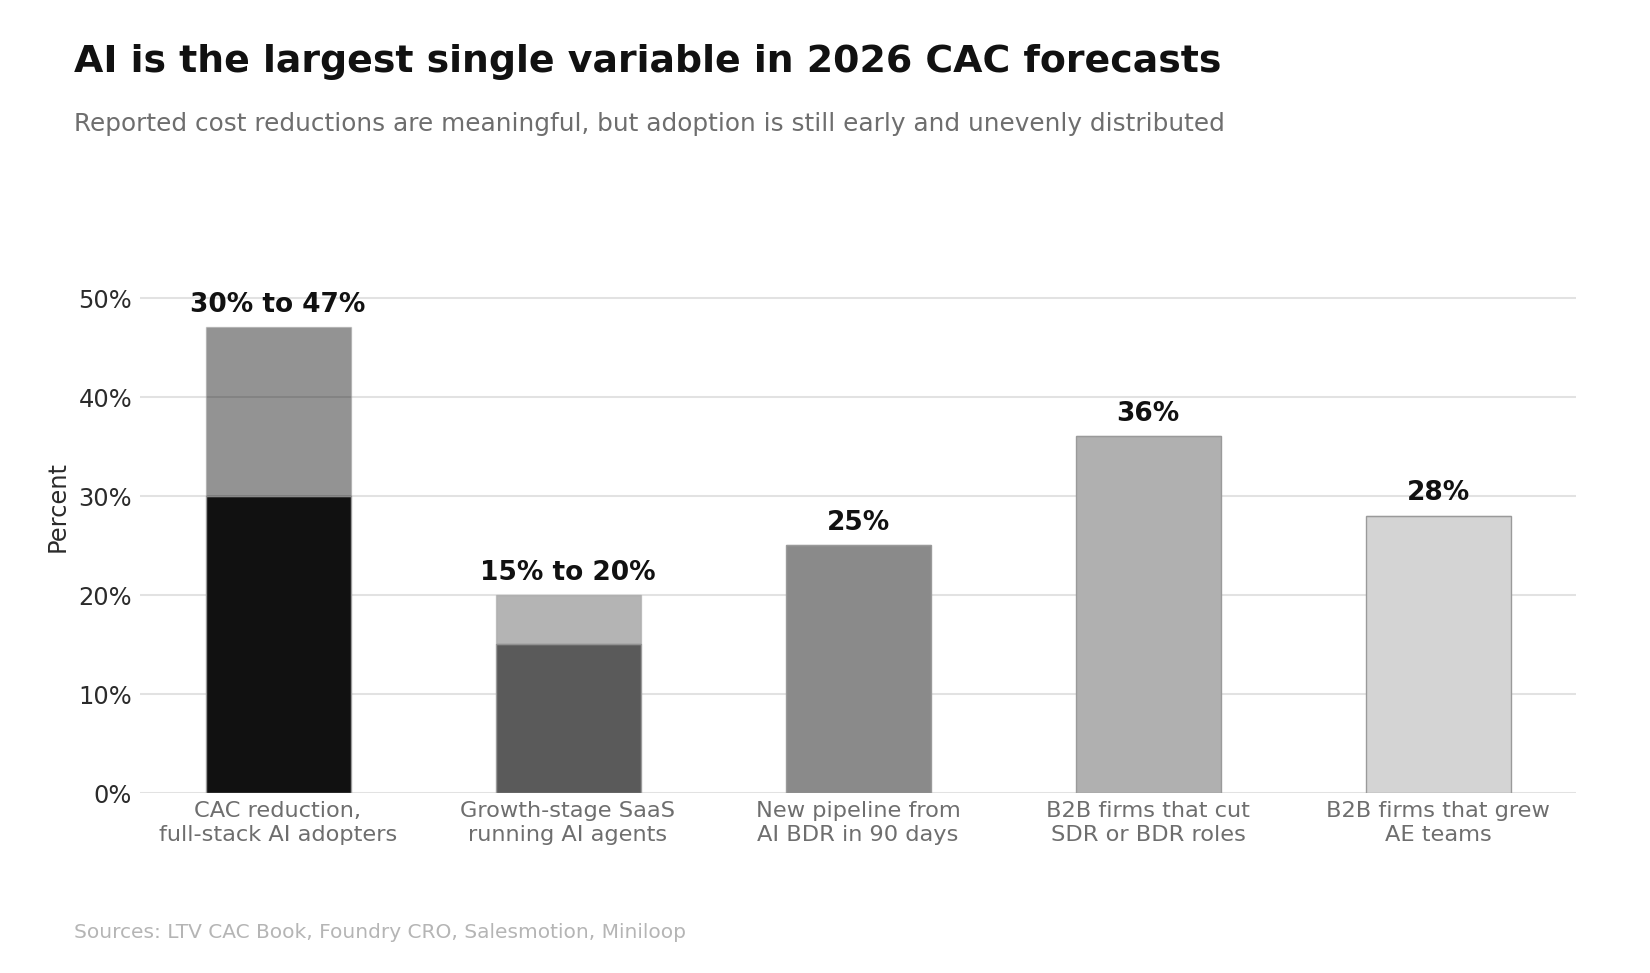
AI is the largest single variable in 2026 CAC forecasts, and the early data is directionally positive but uneven.
Full-stack adopters of AI-powered acquisition report cost reductions of 30% to 47% (Source: LTV CAC Book).
Adoption is still early: 15% to 20% of growth-stage SaaS companies report deploying AI agents in lifecycle marketing, with projections above 40% adoption ahead (Source: Foundry CRO).
Documented deployments show the shape of the shift. One company moved from eight or nine human salespeople to 1.2 humans plus 20 AI agents, with the AI BDR generating 25% of new pipeline within 90 days (Source: Miniloop).
Headcount data reflects the same pressure: 36% of B2B companies cut SDR or BDR roles in 2025 while 28% grew account executive teams (Source: Salesmotion).
Attribution is getting harder in parallel. Platform-reported CAC figures are increasingly modeled rather than measured, and generative search is pulling impression-to-click conversion away from organic listings (Source: Eightx).
That measurement gap is covered well in this piece on why B2B attribution is broken.
Retention Economics Against Acquisition Economics
The cheapest customer is usually one you already have.
- Acquiring a new customer costs 5 to 7 times more than retaining an existing one, with some estimates reaching 25 times depending on industry (Source: Ringly).
- A 5% improvement in retention drives profit increases of 25% to 95% (Source: Ringly).
- The probability of selling to an existing customer is 60% to 70%, versus 5% to 20% for a new prospect (Source: Ringly).
- 88% of subscription brands reported higher acquisition costs in 2025 (Source: Ringly).
- 75% of software companies saw declining retention in 2024 (Source: Genesys Growth).
Conversion Efficiency as a CAC Lever
Acquisition spend is wasted downstream far more often than teams model.
Average SaaS activation rate is 37.5% and onboarding completion is 19.2%, meaning 62.5% of acquired users drop off before experiencing core value (Source: Userpilot). Average core feature adoption sits at 24.5% with a median of 16.5% (Source: Userpilot).
Velocity is the other lever. Reducing sales cycle length by 10% is mathematically equivalent to reducing CAC by roughly 7% to 9% in sales-led motions, which is why pipeline velocity has overtaken win rate as the metric most correlated with CAC efficiency (Source: Digital Applied).
Our guides to conversion rate optimization and MQL versus SQL cover the qualification and funnel work behind those gains.
The Measurement Problem Behind Most CAC Numbers
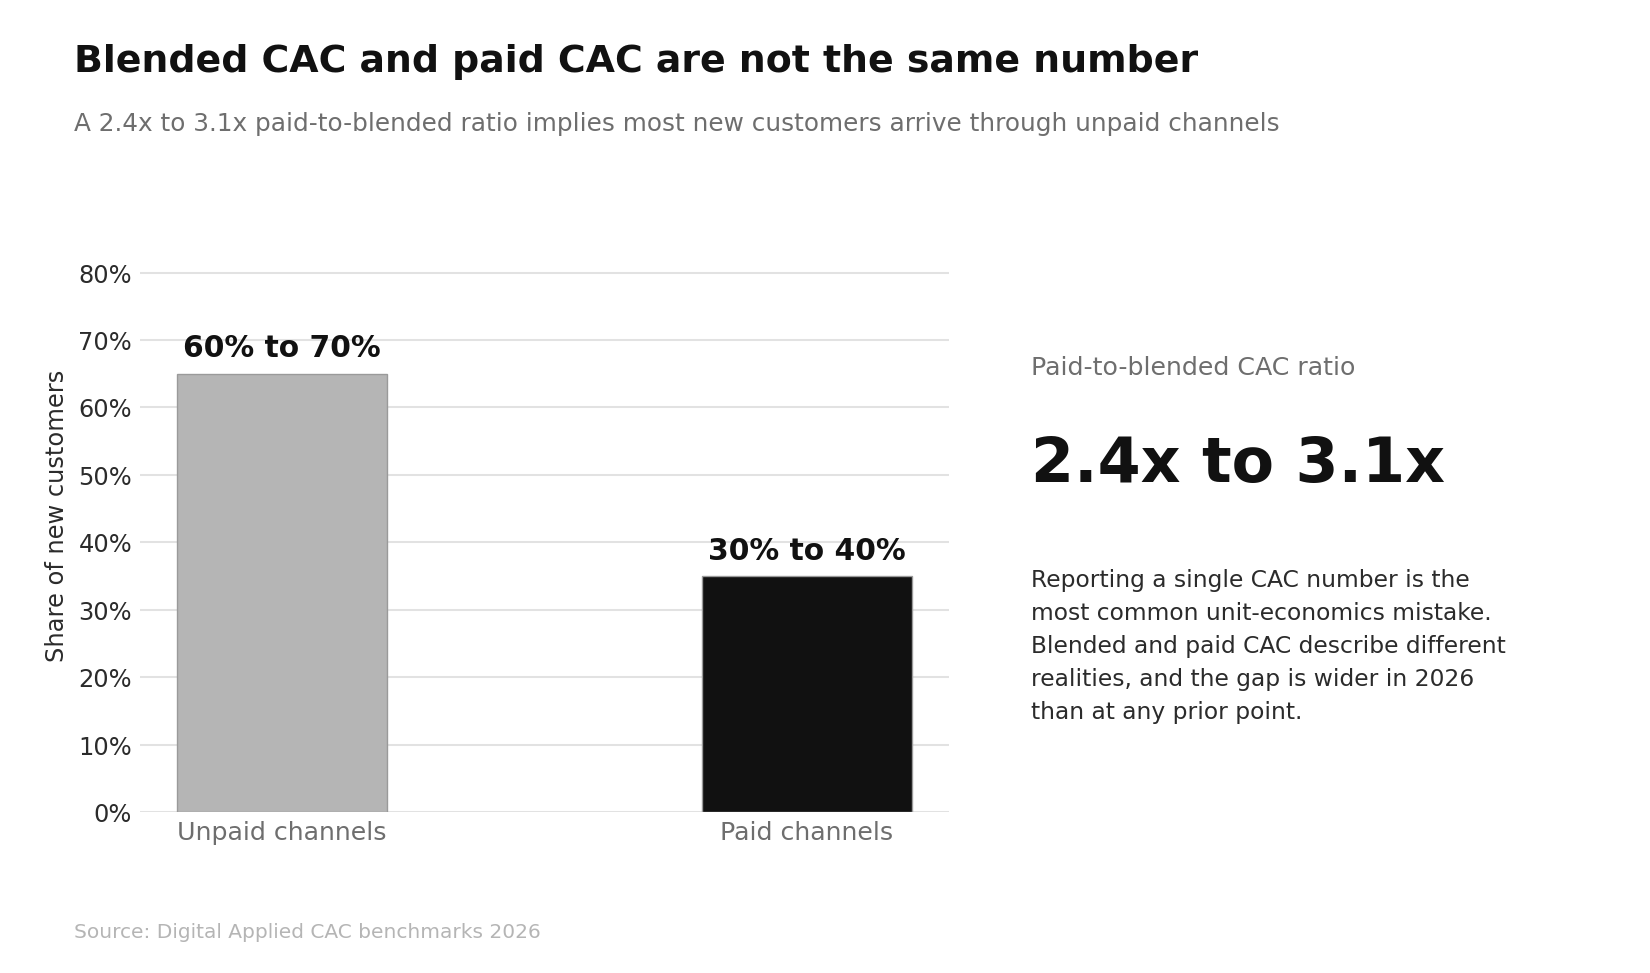
Reporting a single CAC figure is the most common unit-economics mistake, because blended CAC and paid CAC describe different realities, and the gap between them is wider in 2026 than at any prior point (Source: Digital Applied).
A paid-to-blended CAC ratio of 2.4x to 3.1x implies roughly 60% to 70% of new customers arrive through unpaid channels including organic search, brand-direct, referral, product-led signup, community, and content (Source: Digital Applied).
Fully loaded CAC should include paid media, sales salaries and commissions prorated to new logo activity, marketing salaries, and tooling (Source: Konabayev).
For the wider efficiency picture, see SaaS benchmarks by ARR stage, our explainer on the SaaS magic number, and our overview of account-based marketing.
Conclusion
GrowthCentr publishes the benchmark data that revenue teams use to defend budgets, model payback, and decide where the next acquisition dollar goes.
Customer acquisition cost has risen sharply and consistently across nearly every industry, with compounded increases above 260% over nine years and a median B2B SaaS payback period of 15 to 16 months.
Segment, motion, and channel explain far more of the variance than industry averages do, with organic acquisition running roughly half the cost of paid, referral and partner channels leading on efficiency but constrained on volume, and enterprise CAC sitting more than an order of magnitude above product-led.
The teams pulling ahead in 2026 are the ones separating blended from paid CAC, loading headcount costs honestly, and treating activation and retention as acquisition levers rather than post-sale concerns.
Read Next
FAQs
1. What is a good customer acquisition cost in 2026?
A good customer acquisition cost in 2026 depends on segment, but benchmarks put product-led companies under $500, SMB at $200 to $700, mid-market at $1,200 to $2,000, and enterprise from $5,000 upward. The stronger test is whether CAC pairs with an LTV to CAC ratio of at least 3:1 and a payback period inside 12 to 18 months.
2. What is the average CAC payback period for B2B SaaS?
The average CAC payback period for B2B SaaS is 15 to 16 months in 2026. Top-quartile companies recover acquisition costs in 6 to 8 months, while bottom-quartile performers take 24 to 36 months, with deal size and go-to-market motion driving most of the spread.
3. How much has customer acquisition cost increased?
Customer acquisition cost has increased roughly 263% over nine years, including an 18.4% year-over-year rise recorded in 2025. Industry-wide analysis also shows a 60% increase over the past five years, driven by auction inflation, signal loss, longer buying cycles, and larger buying committees.
4. Which acquisition channel has the lowest CAC?
The acquisition channel with the lowest CAC is referral, at $15 to $50 per customer, followed by organic search at $70 to $120 and content marketing at roughly $92 (Source: Userpilot). Referral is volume-constrained, generating only 5% to 20% of total customer acquisition, so it works best alongside broader channels.
5. Why is organic CAC lower than paid CAC?
Organic CAC is lower than paid CAC because organic channels build compounding assets rather than renting attention, averaging $942 per customer against $1,907 for paid in B2B. The tradeoff is ramp time, since organic requires upfront investment before returns arrive, while paid delivers immediate volume that stops the moment spend stops.
Disclaimer: This content is provided for informational purposes only and does not constitute legal, financial, or compliance advice. Protocol versions, governance arrangements, and partner counts cited here reflect publicly announced milestones as of August 2026 and are moving quickly. Adoption figures come from vendor and foundation announcements with differing methodologies and should be treated as directional signals rather than guaranteed outcomes.