

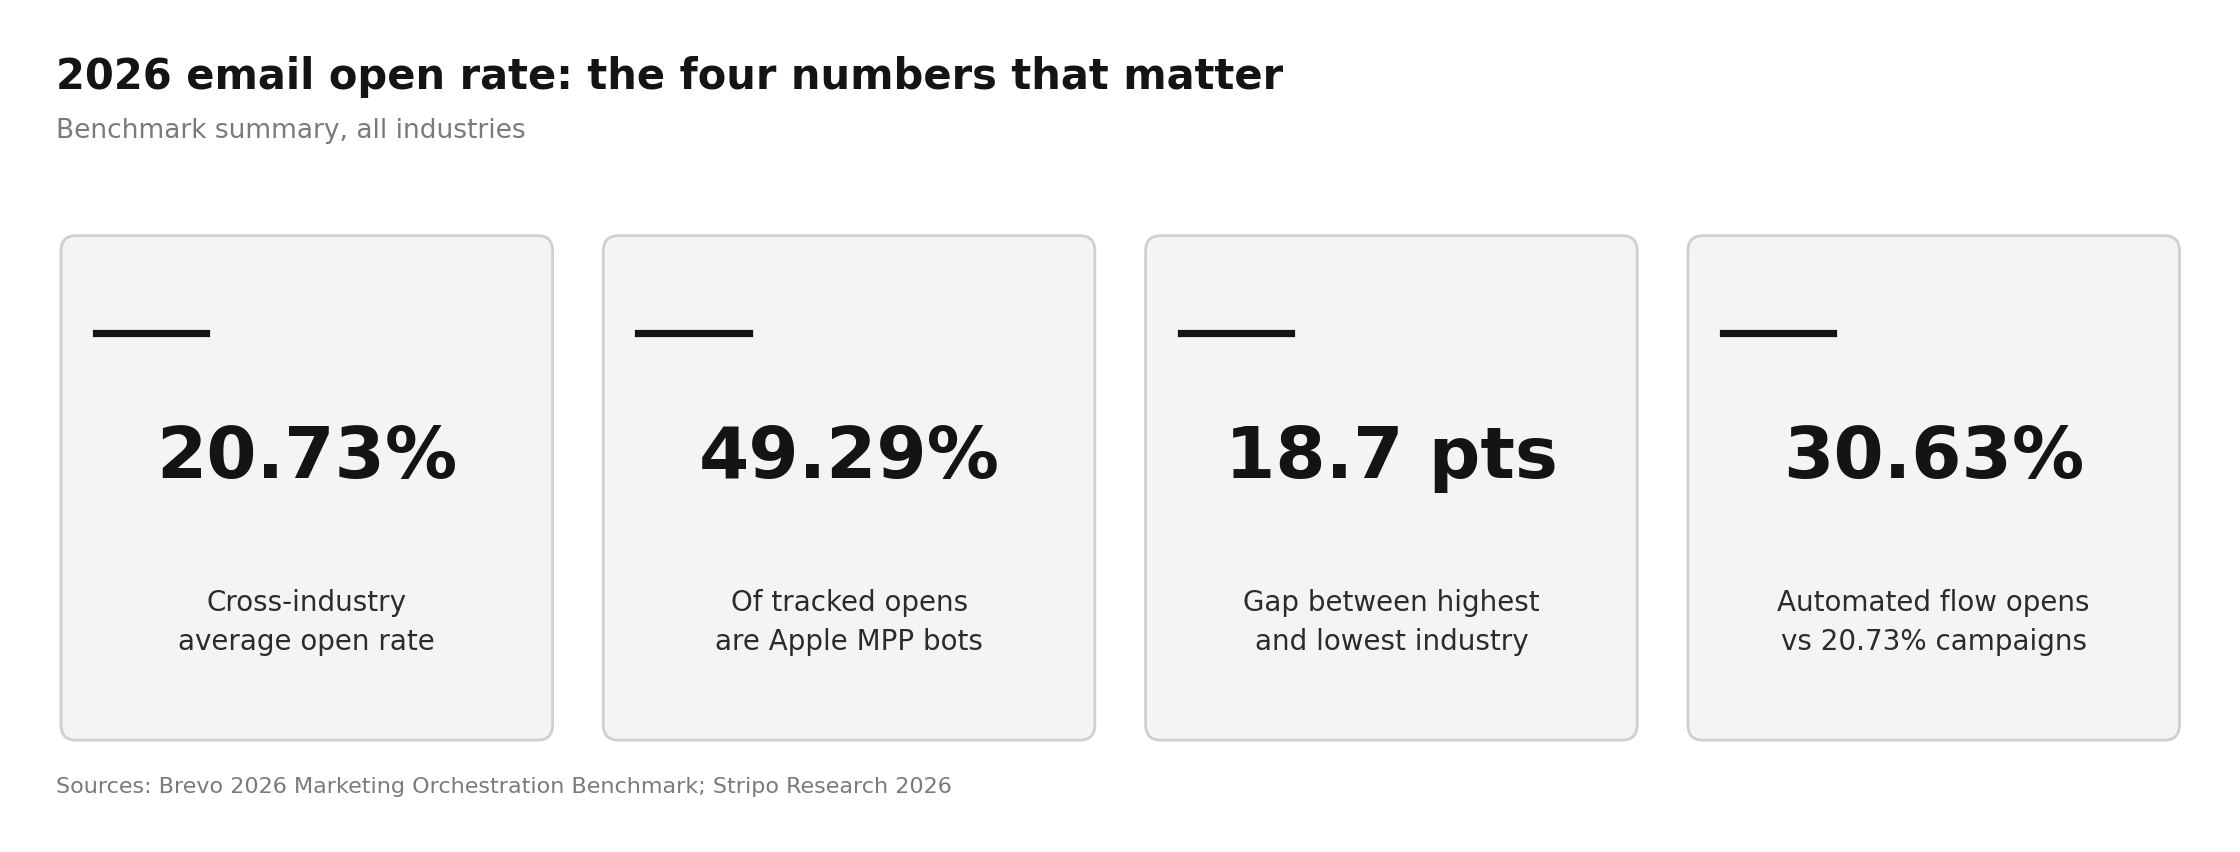
The average email open rate across all industries is now 20.73%, or 33.87% once Apple Mail Privacy Protection opens are counted, according to first-party data from more than 175,000 active senders (source: Brevo).
Growth Centr tracks the benchmark data that B2B and ecommerce operators actually use to make budget decisions, and email open rate is one of the most misread numbers in the entire marketing stack.
The 13-point gap between those two figures is not a rounding error.
It is the reason a marketing lead in retail and a marketing lead in government services can both claim to be "above average" while measuring completely different things.
This report breaks down average email open rates by industry across every major dataset published in 2026, explains why the numbers disagree so violently, and gives you the adjusted benchmarks to compare yourself against.
Key Takeaways
- Cross-industry average open rate is 20.73%, or 33.87% including Apple MPP opens.
- Apple Mail Privacy Protection now drives roughly half of all tracked email opens.
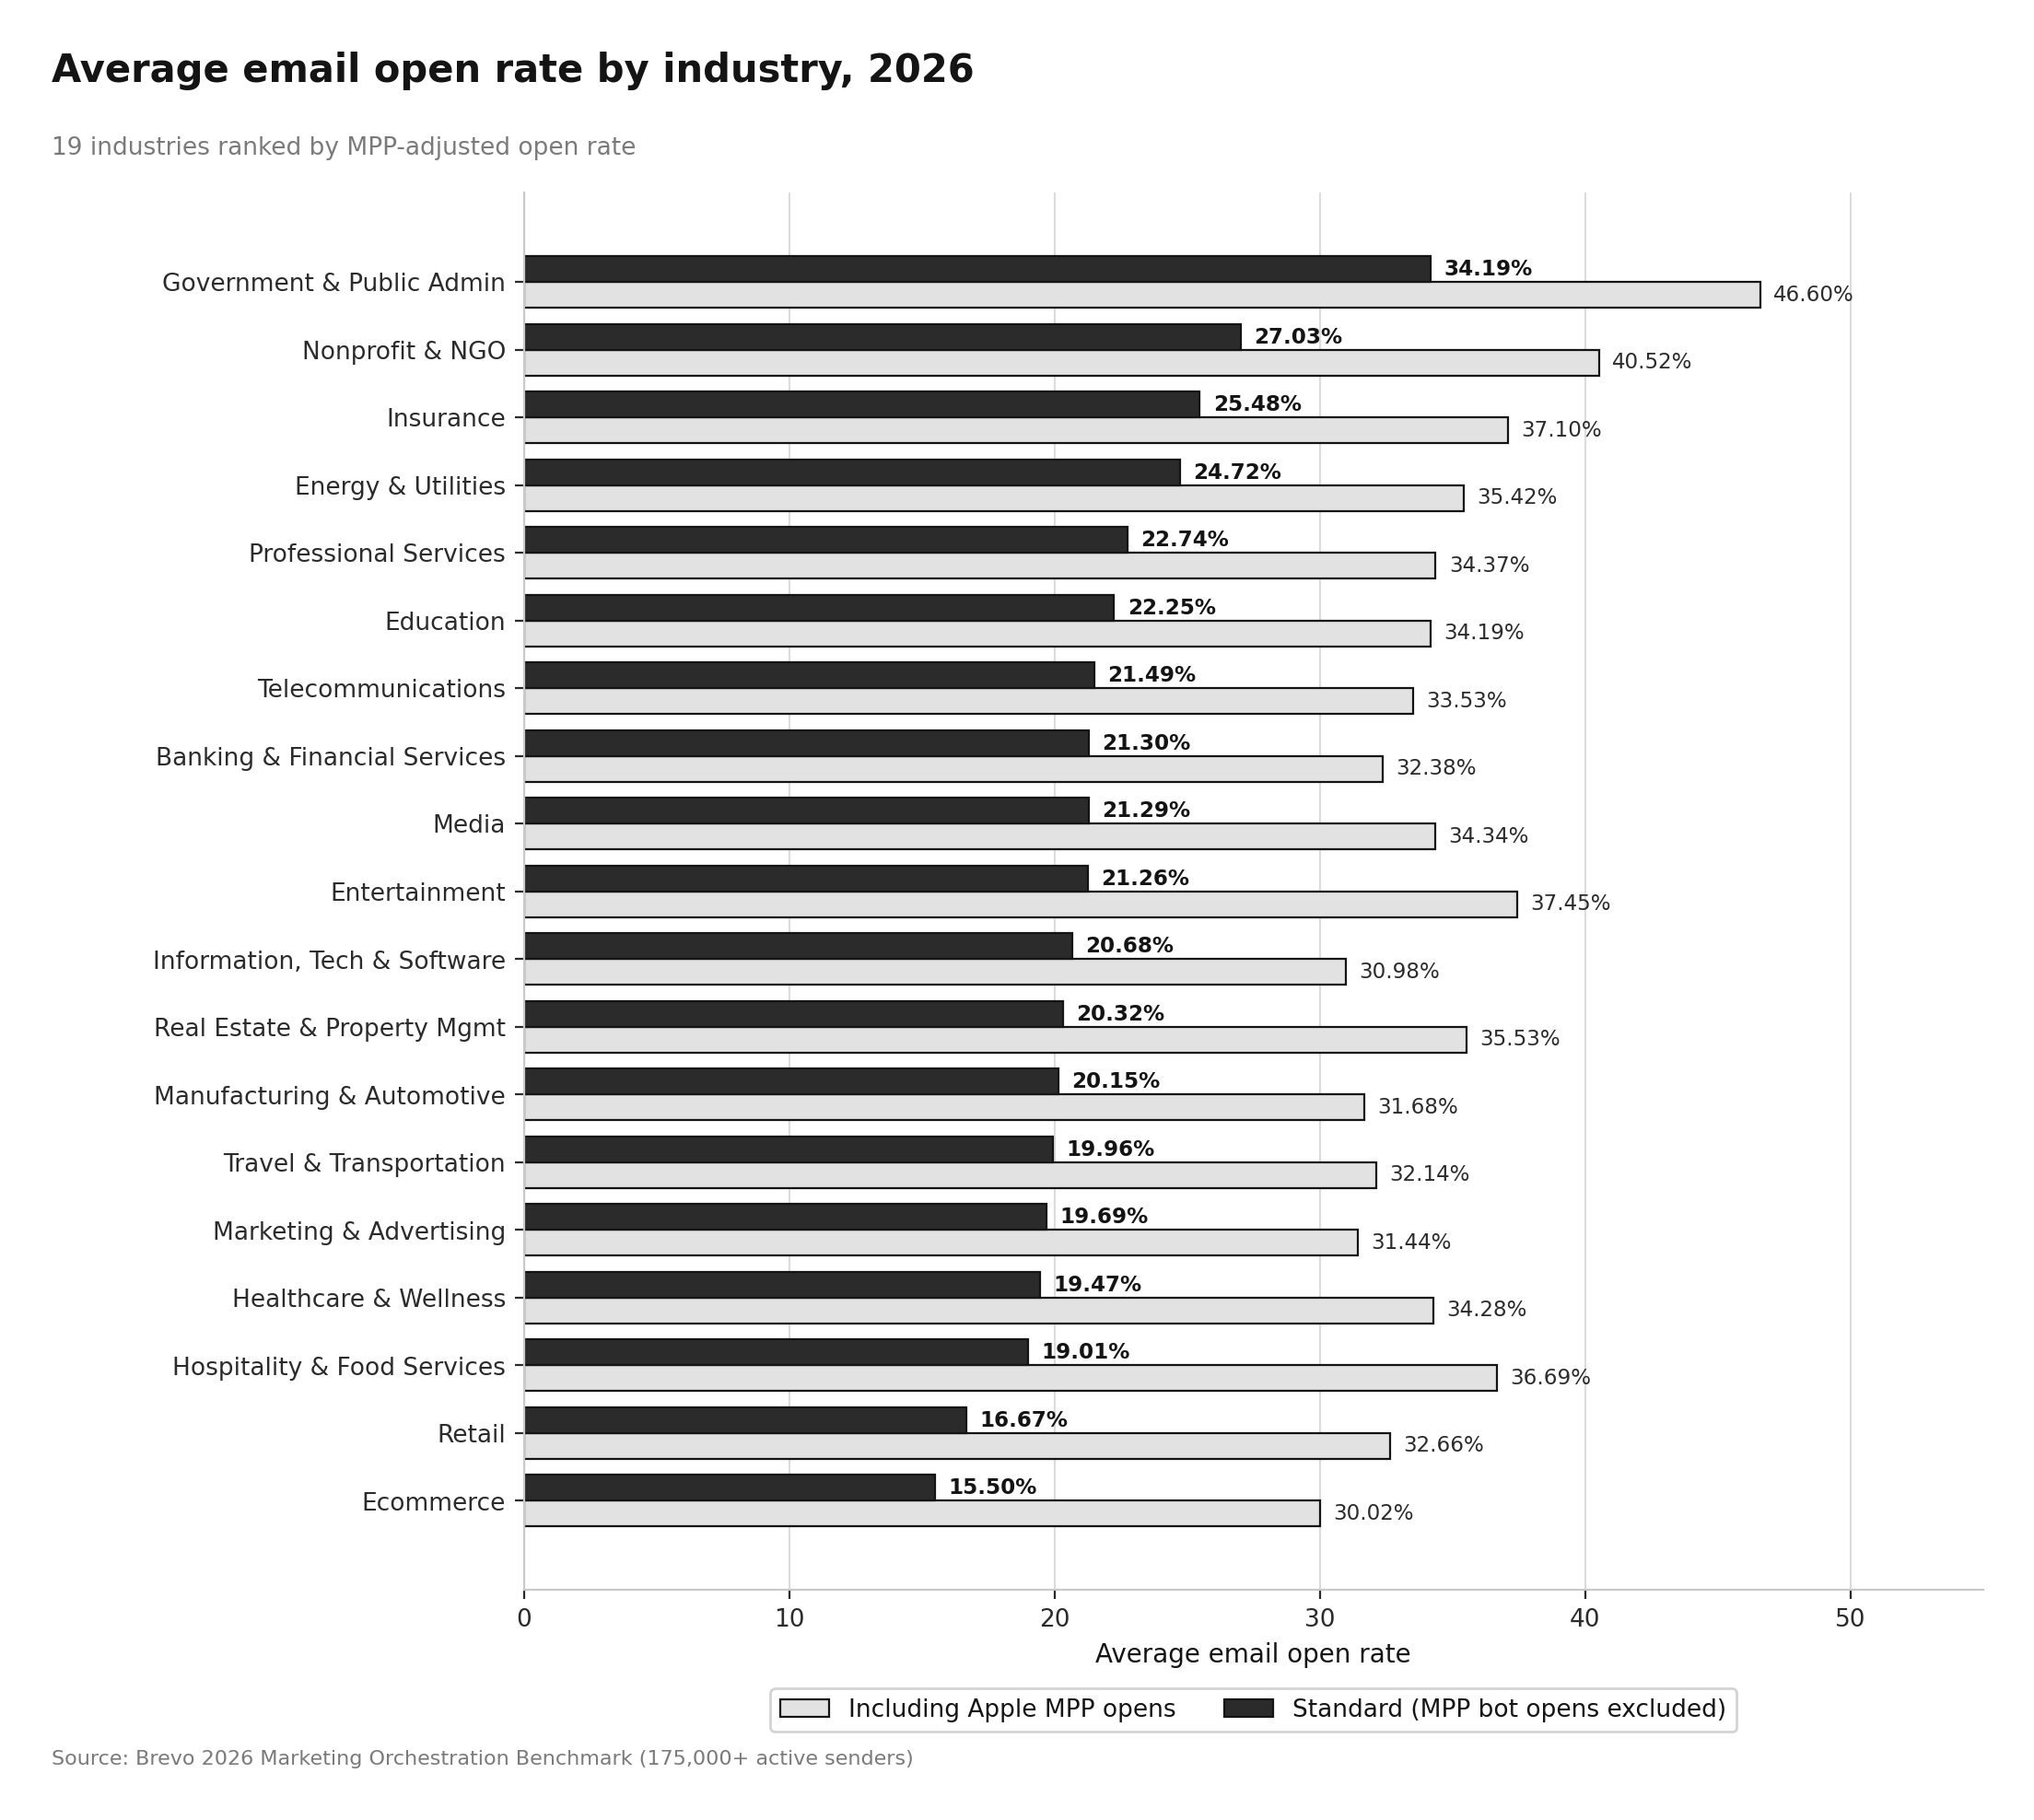
- Government leads all industries at 34.19%; ecommerce trails at 15.50%.
- Automated flows open at 30.63% versus 20.73% for standard broadcast campaigns.
- Company size shifts cold open rates 22 points, more than industry does.
The Email Landscape Entering 2026
Global email volume sits near 392 billion messages sent and received daily, and the average B2B professional now receives between 120 and 150 emails per day (source: Stripo Research).
Inbox saturation is no longer a talking point. It is the operating condition.
At the same time, roughly 87% of emails are now AI-assisted or fully automated, which has pushed mailbox providers to score content relevance rather than sender reputation alone.
The channel still returns strong economics relative to paid media, which is why it keeps absorbing budget even as engagement gets harder to measure.
If you are building a broader picture of channel efficiency, our breakdown of marketing ROI statistics puts email alongside paid search and social.
Volume alone does not explain the benchmark chaos, though. Measurement does.
Why Industry Open Rate Benchmarks Disagree by 30 Points
Since iOS 15 shipped in September 2021, Apple Mail Privacy Protection routes remote content requests through Apple proxy servers, which preload tracking pixels whether or not a human ever reads the message.
That generates a machine open indistinguishable from a real one.
Apple Mail now accounts for 49.29% of every tracked email open, and analysts put true human B2B open rates at 15% to 25% while dashboards report 35% to 55% (source: Stripo Research).
Inflation runs 15 to 20 percentage points for a typical list.
This is why the same question produces answers 28 points apart:
| Source | Reported average | What it measures |
|---|---|---|
| MailerLite | 43.46% | 3.6M campaigns, mixed B2B and B2C, MPP included |
| Brevo (MPP-inclusive) | 33.87% | 175K senders, MPP counted |
| Klaviyo | 31.0% | 183K ecommerce brands, campaigns only |
| Brevo (standard) | 20.73% | 175K senders, MPP bot opens excluded |
| Optifai | 21.3% | 939 B2B SaaS companies, sales emails |
Every one of those numbers is correct for its dataset. None is correct for yours until you match the methodology.
Average Email Open Rate by Industry in 2026
Brevo's benchmark is the most useful headline dataset because it publishes both figures side by side, from first-party campaign data across 175,000 active senders (source: Brevo).
The spread from government to ecommerce is 18.69 percentage points.
The pattern is consistent: industries where subscribers opt in out of necessity or genuine conviction outperform industries competing on discounts.
The Wider View: 46 Industries, MPP Included
MailerLite's dataset covers 3.6 million campaigns from 181,000 accounts. It includes machine opens, so treat the numbers as relative rankings rather than absolute performance (source: MailerLite).
| Industry | Open rate | Click rate | CTOR |
|---|---|---|---|
| Religion | 55.71% | 2.95% | 7.58% |
| Hobbies | 53.25% | 3.30% | 8.45% |
| Non-profit | 52.38% | 2.90% | 8.24% |
| Art gallery and museum | 50.43% | 2.66% | 6.28% |
| Government | 48.52% | 3.05% | 8.44% |
| Health and fitness | 47.81% | 1.45% | 4.45% |
| Consulting | 45.96% | 2.41% | 7.67% |
| Recruitment and staffing | 45.26% | 1.68% | 5.29% |
| Insurance | 44.40% | 1.36% | 3.19% |
| Higher education | 43.98% | 2.15% | 9.15% |
| Medical, dental and healthcare | 43.75% | 2.25% | 7.31% |
| Business and finance | 43.34% | 2.37% | 7.96% |
| Legal | 42.58% | 4.90% | 14.72% |
| Real estate | 40.37% | 1.72% | 6.72% |
| Software and web app | 39.31% | 1.15% | 5.40% |
| Retail | 37.47% | 1.27% | 4.51% |
| Manufacturing | 37.36% | 4.22% | 14.82% |
| Marketing and advertising | 37.23% | 1.30% | 6.09% |
| Computers and electronics | 35.29% | 1.37% | 4.83% |
| Publishing | 34.24% | 2.82% | 9.12% |
| E-commerce | 32.67% | 1.07% | 4.01% |
| Travel and transportation | 30.10% | 1.68% | 6.34% |
Two industries reveal what the open rate hides. Manufacturing ranks 17th on opens but first on click-to-open at 14.82%, and legal ranks 13th on opens with the highest click rate in the dataset at 4.90%.
In low-volume verticals, every open is a signal. In saturated verticals like software, opens are diluted noise.
Ecommerce Open Rates by Sub-Vertical
Ecommerce is not one benchmark. Klaviyo's 2026 dataset of more than 183,000 brands shows campaign open rates clustering between 29% and 33% depending on category (source: Klaviyo).
| Ecommerce vertical | Open rate | Click rate | Placed order rate |
|---|---|---|---|
| Clothing and Accessories | 33.1% | 1.62% | 0.12% |
| Home and Garden | 32.5% | 1.83% | 0.13% |
| Jewelry | 32.5% | 1.54% | 0.08% |
| Sporting Goods | 31.9% | 1.88% | 0.11% |
| Toys and Hobbies | 31.7% | 2.03% | 0.19% |
| Food and Beverage | 31.2% | 1.94% | 0.26% |
| Hardware and Home Improvement | 30.9% | 1.65% | 0.11% |
| Health and Beauty | 30.5% | 1.63% | 0.19% |
| Electronics | 29.3% | 1.77% | 0.09% |
| All ecommerce | 31.0% | 1.69% | 0.16% |
Food and beverage leads on placed order rate at 0.26% because high-frequency consumables attract buyers who are always close to repurchase.
Electronics lags on opens because those buyers research extensively before committing.
B2B Open Rates by Industry and Sales Motion
B2B behaves differently enough to need its own baseline.
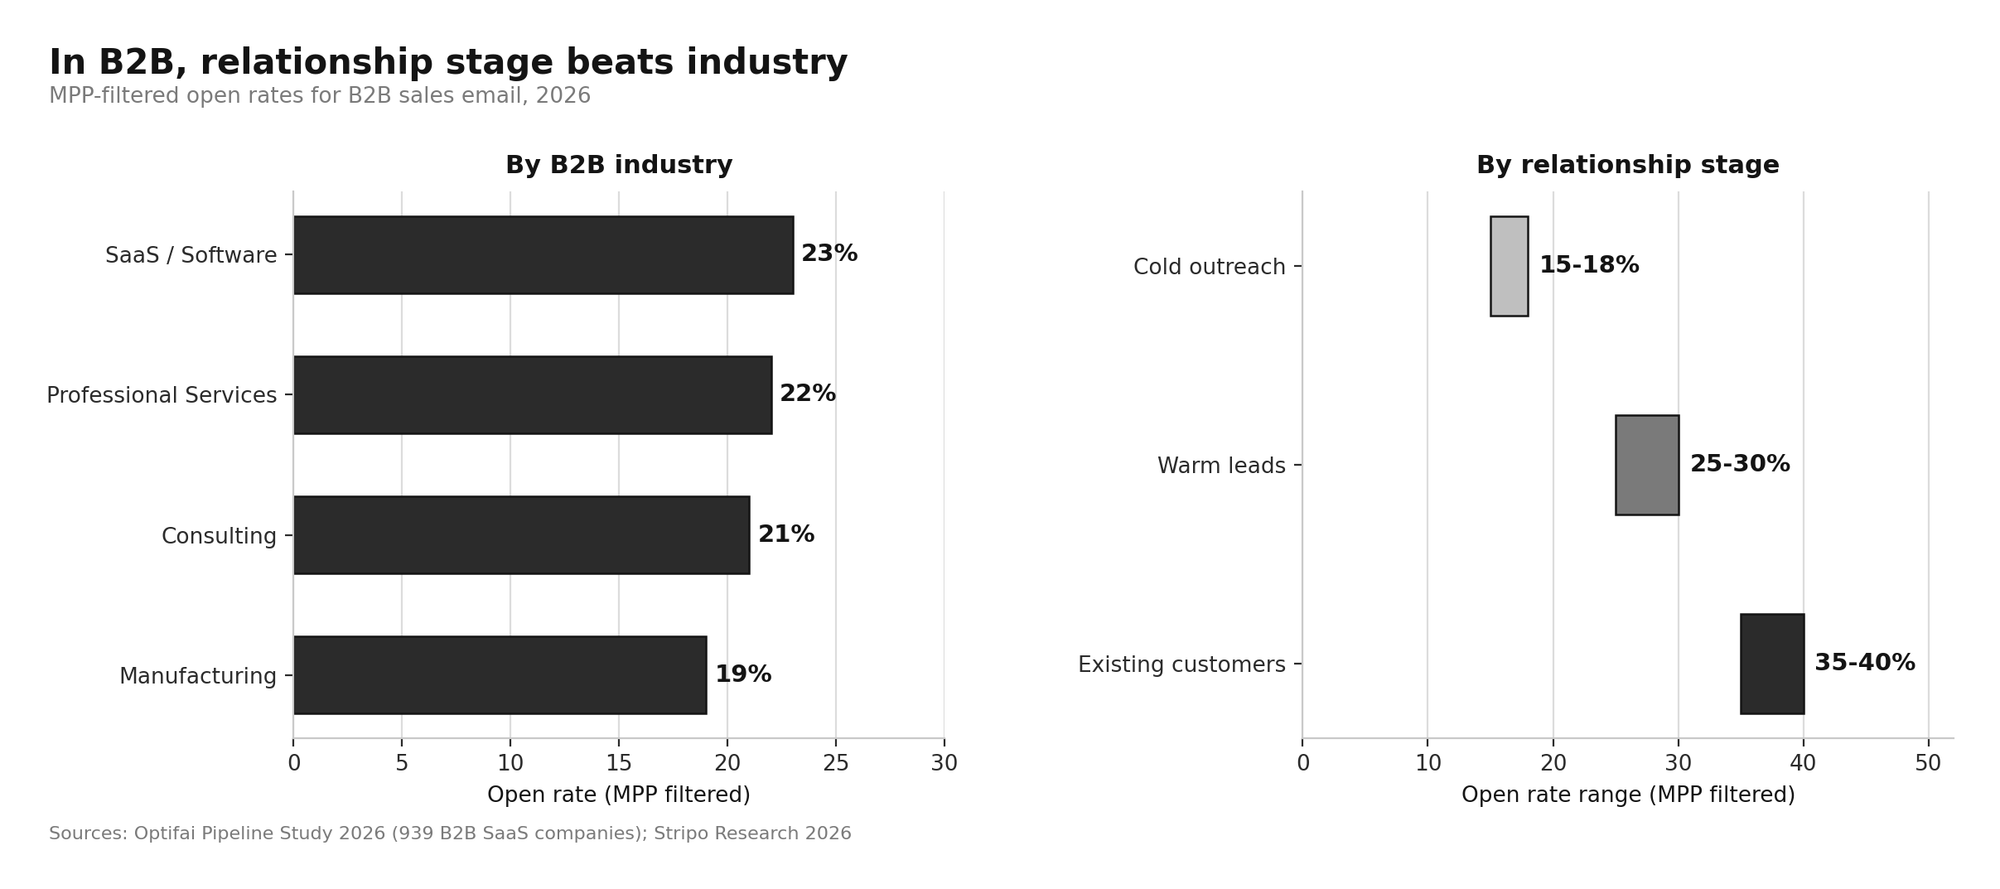
Filtered for machine opens, B2B sales email open rates sit at 23% for SaaS and software, 22% for professional services, 21% for consulting, and 19% for manufacturing (source: Optifai).
Relationship stage moves the number more than industry does. Cold outreach to net-new prospects lands at 15% to 18%, warm leads at 25% to 30%, and existing customers at 35% to 40% (source: Stripo Research).
For cold outreach specifically, with MPP inflation included, SaaS and software leads have 47.1% open rates but post the lowest reply rate at 1.9% to 3.5%, while legal services open at 38% to 42% with roughly 10% replies (source: Martal).
High opens with low replies is the signature of a saturated inbox.
If cold outbound is a core motion for you, cold email reply rate benchmarks are the more honest scorecard, and our guide to where AI SDRs work and where they break covers the operational side.
Company Size Beats Industry
The single most underrated finding in 2026 benchmark data: cold email to small businesses with 1 to 50 employees opens at 51.2%, while cold email to enterprises with 5,000-plus employees opens at 29.4% (source: coldmailopenrate.com).
That 22-point gap dwarfs the 4-point gap between industries at the same company size. It reflects email security infrastructure, not buyer interest.
Large enterprises run Proofpoint, Mimecast, and Barracuda, which quarantine cold email before it reaches an inbox. For enterprise targeting, 35% is genuinely strong.
Open Rates by Email Type
Email type moves the number more than any subject line test.
Across Brevo's dataset, automation and transactional emails average a 30.63% open rate and 7.39% click-through rate, against 20.73% and 2.27% for standard campaigns (source: Brevo).
The revenue implication is larger than the engagement one. Automated flows generate roughly 41% of all email revenue from just 5.3% of total send volume, with flow revenue per recipient at $1.94 against $0.11 for campaigns (source: Klaviyo).
That is an 18x gap driven entirely by timing and intent, not copywriting.
A single program will therefore see open rates from 15% on cold outbound to 60%-plus on transactional in the same week, from the same sender, to the same audience. Blending them into one program-wide number destroys the signal.
Open Rates by Region
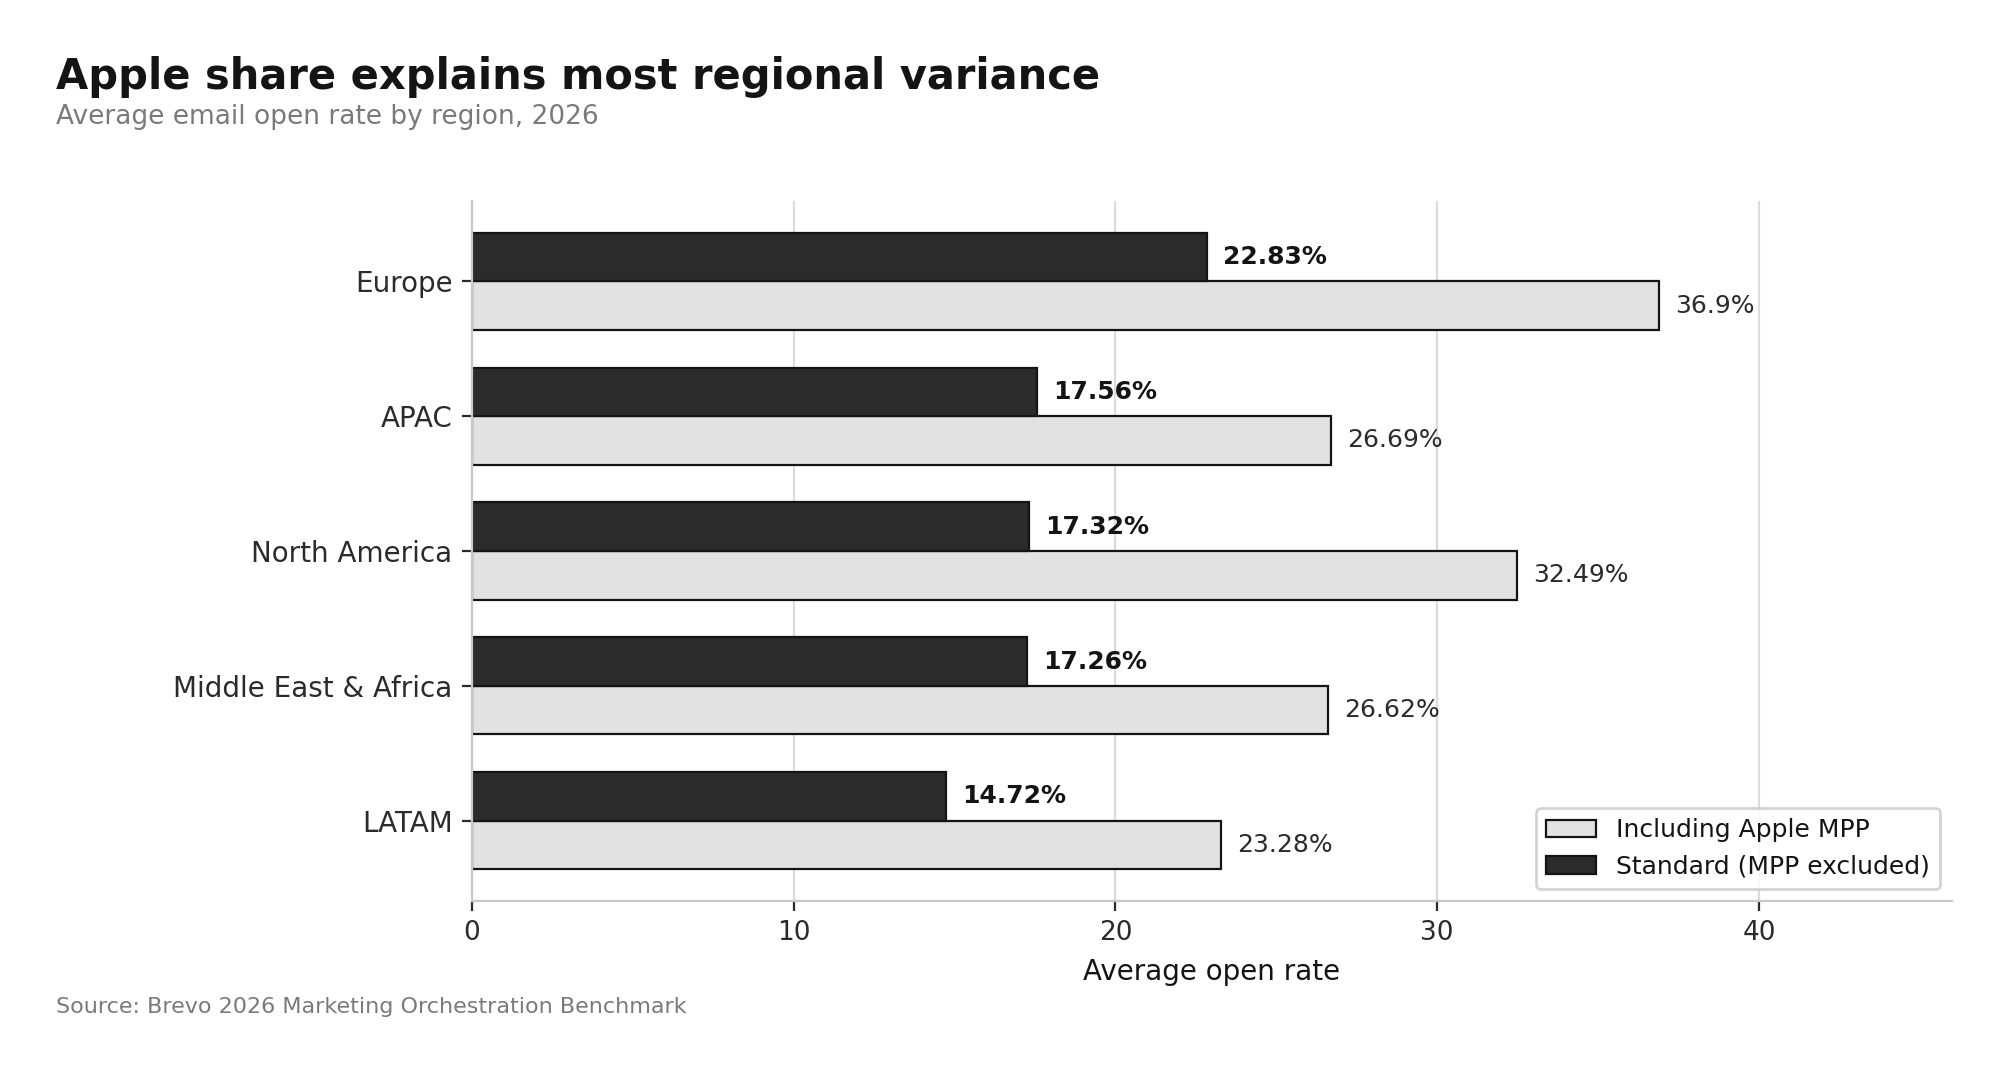
Geography changes the benchmark because iPhone penetration changes MPP exposure.
Europe leads at a 22.83% standard open rate, ahead of APAC at 17.56%, North America at 17.32%, Middle East and Africa at 17.26%, and LATAM at 14.72% (source: Brevo).
North America underperforms Europe on standard open rate while looking stronger on MPP-inclusive numbers, which is exactly what high Apple share predicts.
If you are a US team benchmarking against European data, you will look like you are winning by default.
Deliverability Sets the Floor Under Every Benchmark
An open rate is downstream of inbox placement, and placement has deteriorated.
Q1 2025 saw Office365 inbox rates fall to 50.70% from 77.43% a year earlier, a 26.7-point collapse, while Outlook and Hotmail dropped to 26.77% (source: The Digital Bloom).
Current placement rates by provider run 87.2% for Gmail, 86.0% for Yahoo, 76.3% for Apple, and 75.6% for Microsoft (source: Validity).
Three fixes carry disproportionate weight. Full SPF, DKIM, and DMARC authentication produces roughly 95% to 98% inbox placement against under 85% without it.
Removing invalid addresses lifts opens and clicks by 15% to 25%, yet 39% of senders rarely or never clean their lists. Lists decay at 2% to 3% per month (source: Stripo Research).
Choosing the right stack matters here too, and email verification tools plus a properly configured email marketing platform do most of this work automatically.
What Separates Top Performers From Average
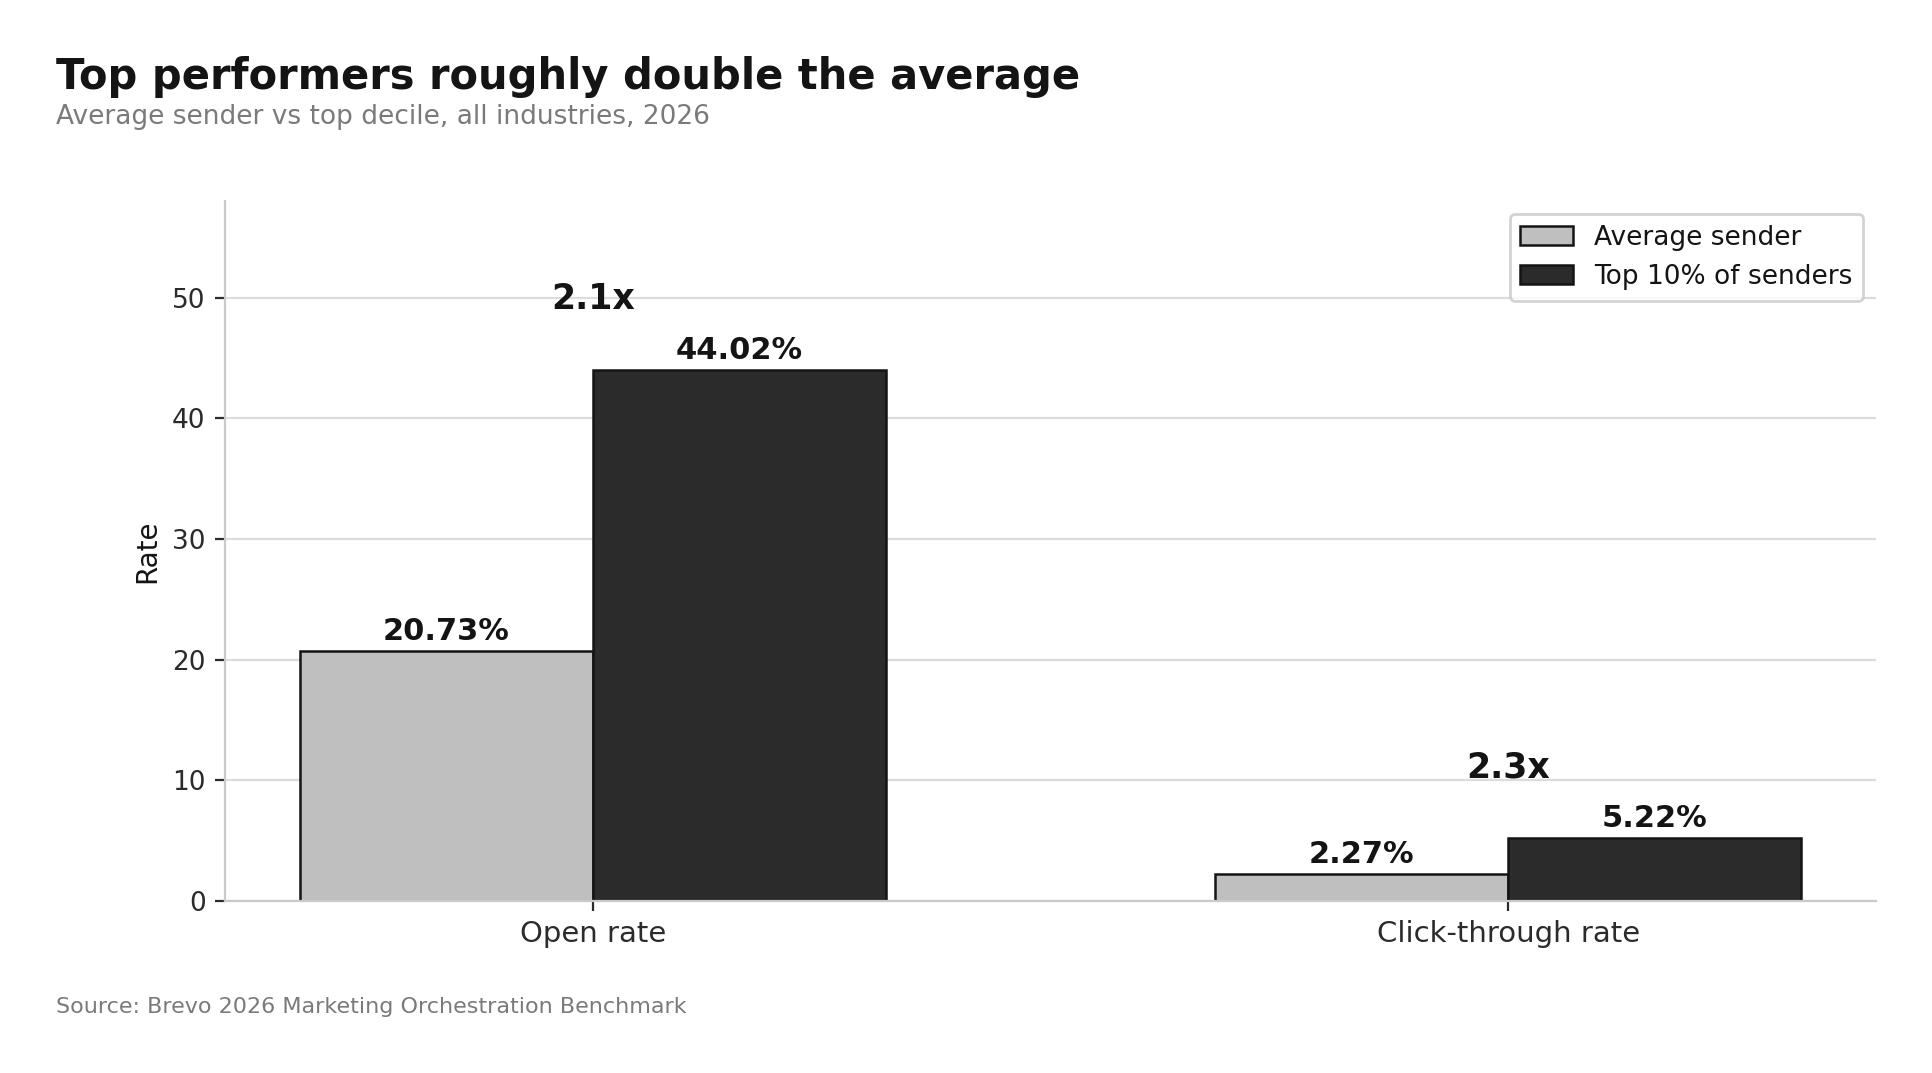
Top 10% performers reach a 44.02% open rate against the 20.73% average, and a 5.22% click-through rate against 2.27% (source: Brevo). Roughly double, in both cases.
The levers are documented rather than mysterious. Personalized subject lines referencing name and company hit 46% opens against 35% generic, a 31% lift in opens and a 133% lift in replies across 5.5 million emails (source: Belkins).
Switching from a brand sender to a named individual lifts opens anywhere from 4% to 57%. Responding to an inbound lead within five minutes produces a 51% open rate on the first follow-up, against 12% after 24 hours (source: Stripo Research).
Speed, list quality, and authentication beat subject line craft.
That ordering surprises most teams. It is also why conversion rate optimization work downstream of the open often returns more than another round of subject line tests.
How to Build Your Own Industry-Adjusted Benchmark
Comparing yourself to a published average is close to useless without three adjustments:
- First, match the measurement method. If your ESP does not filter MPP, compare against MPP-inclusive figures only, or subtract 15 to 20 points before comparing to filtered data.
- Second, segment by email type before you average anything. Report cold, nurture, campaign, flow, and transactional separately.
- Third, build a proxy audience. Isolate the segment of your list not on Apple Mail and use its open rate as your true engagement baseline. It is imperfect and still the most reliable workaround available.
Then set your target as a range rather than a point.
Below 25% on an MPP-inclusive campaign signals a list health or deliverability problem rather than a subject line problem. Between 25% and 33% is the healthy middle. Above 45% puts you in the top decile.
What to Track Instead
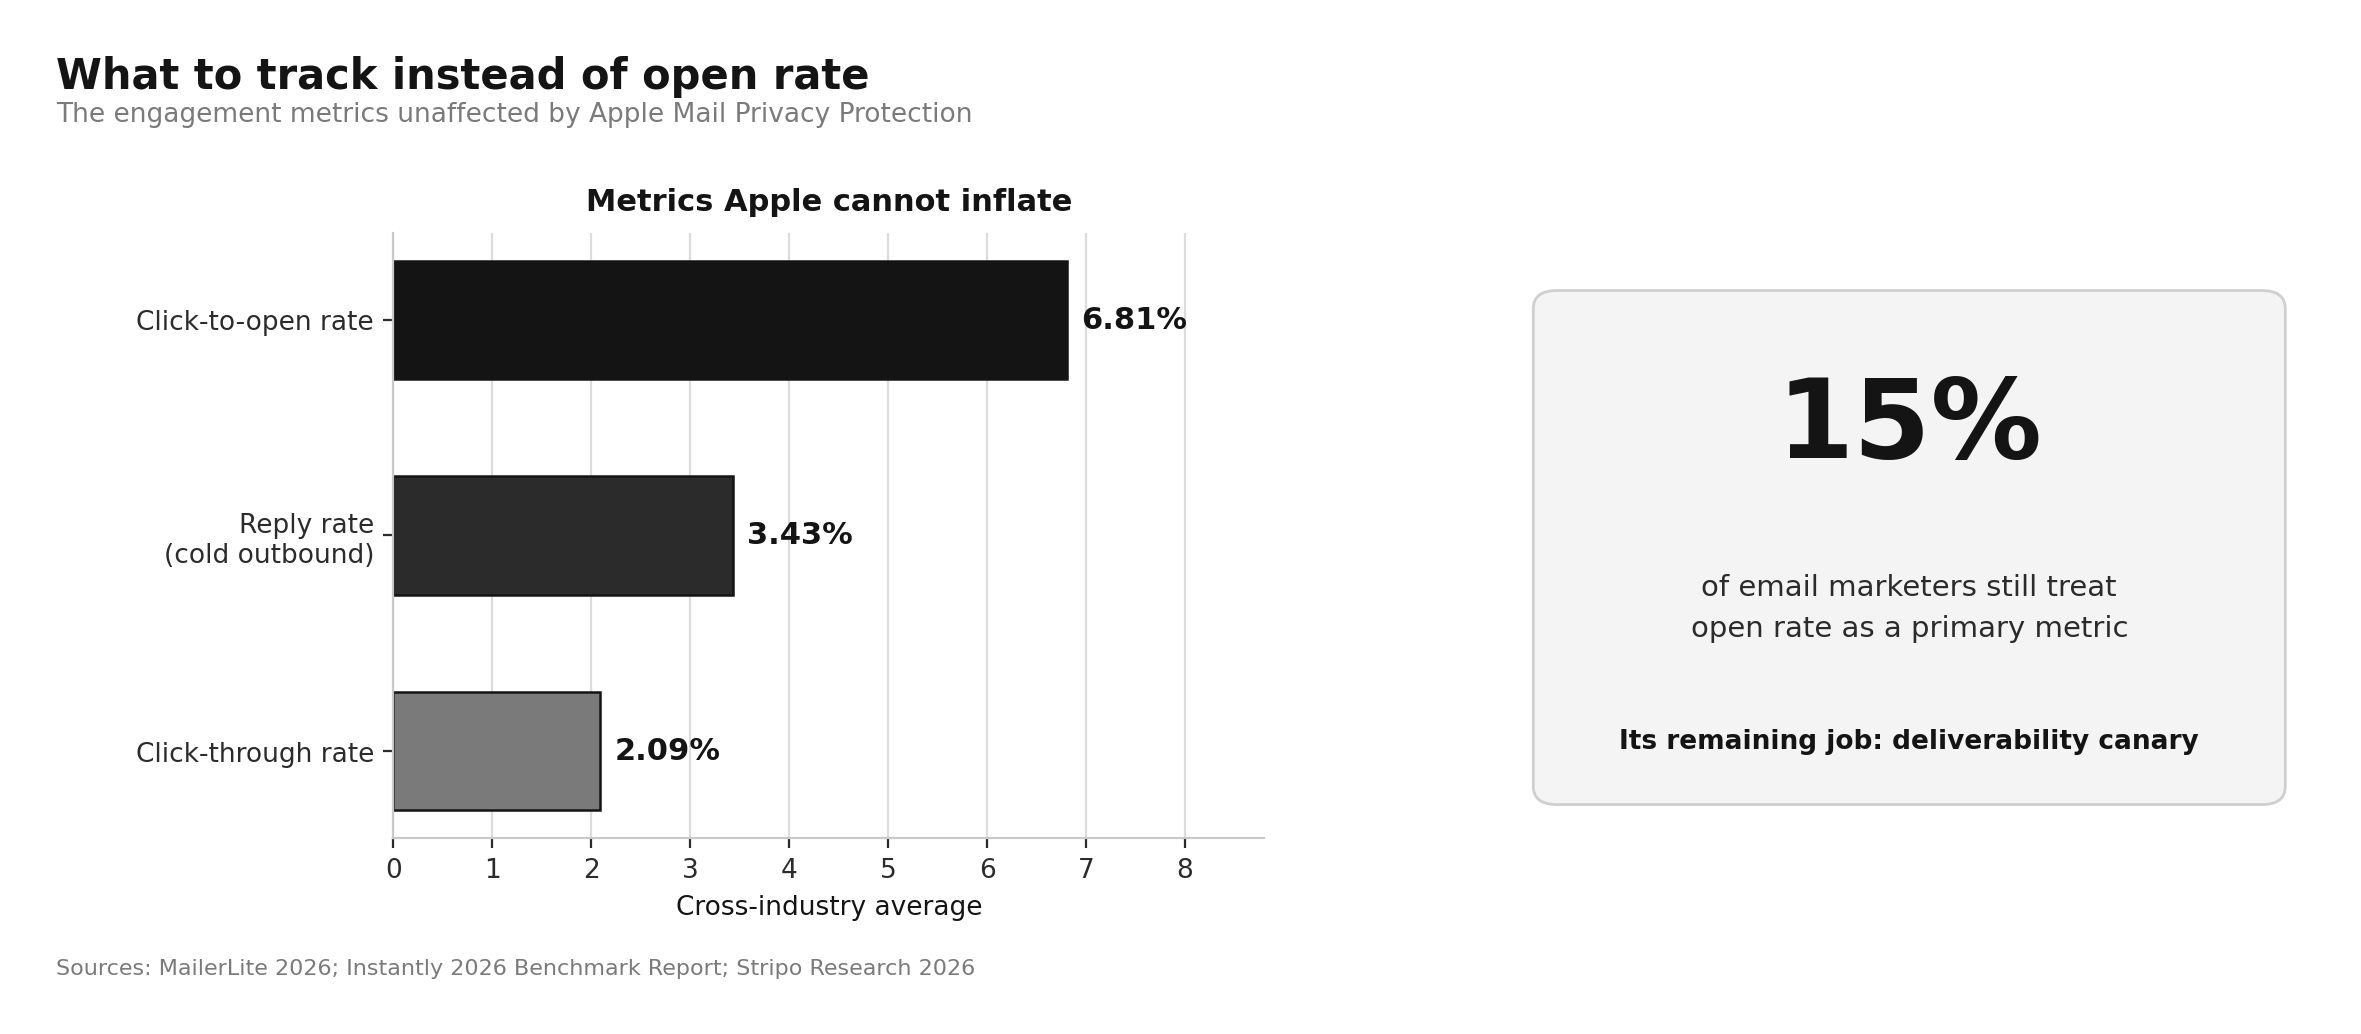
Only about 15% of email marketers still treat open rate as a primary metric, and the reason is structural rather than fashionable.
Click-to-open rate averages 6.81% across industries and cannot be faked by a proxy server. Reply rate averages 3.43% on cold outbound. Revenue per recipient ties the channel to money.
Open rate keeps one job in 2026: it is a deliverability canary. A sudden drop of 10 points or more means something broke.
It no longer tells you whether your campaign was good.
For teams reworking their measurement layer, average cost per lead by industry and lead generation statistics give the downstream numbers that actually connect email to pipeline, and marketing budget benchmarks by industry show how much of the mix email should be earning.
Conclusion
Growth Centr exists to make benchmark data usable rather than decorative, and the 2026 email numbers are a case study in why that distinction matters.
Average email open rate by industry ranges from 15.50% in ecommerce to 34.19% in government on MPP-adjusted data, and from 30.10% to 55.71% on MPP-inclusive data covering 46 sectors.
Roughly half of every tracked open is now a machine event, automated flows outperform campaigns by 10 points on opens and 18x on revenue per recipient, and company size shifts cold outreach performance more than industry does.
The teams winning in 2026 are not the ones with the highest reported open rate.
They are the ones who know which number they are actually looking at.
Read Next
FAQs
1. What is the average email open rate by industry in 2026?
The average email open rate by industry in 2026 ranges from 15.50% for ecommerce to 34.19% for government and public administration on MPP-adjusted data, with an all-industry average of 20.73%. On MPP-inclusive data the same spread runs from 30.10% for travel to 55.71% for religious organizations.
2. Which industry has the highest email open rate?
The industry with the highest email open rate is government and public administration at 34.19% on MPP-adjusted data, and religious organizations at 55.71% on MPP-inclusive data. Both lead because subscribers opt in out of necessity or genuine conviction rather than promotional interest.
3. What is a good email open rate in 2026?
A good email open rate in 2026 is 22% to 30% on MPP-filtered data and 40% to 50% on MPP-inclusive data. Anything below 25% on an inclusive measurement usually signals a list health or deliverability problem rather than a weak subject line.
4. Why are email open rates inflated in 2026?
Email open rates are inflated in 2026 because Apple Mail Privacy Protection preloads tracking pixels through proxy servers regardless of whether a recipient reads the message. Apple Mail now accounts for 49.29% of all tracked opens, inflating reported rates by 15 to 20 percentage points.
5. What should replace open rate as an email KPI?
Open rate should be replaced by click-to-open rate for marketing and nurture campaigns, reply rate for cold outbound, and revenue per recipient for ecommerce. Open rate retains one useful role as a deliverability canary that flags sudden drops of 10 points or more.
Disclaimer: This content is provided for informational purposes only and does not constitute legal, financial, or compliance advice. Protocol versions, governance arrangements, and partner counts cited here reflect publicly announced milestones as of August 2026 and are moving quickly. Adoption figures come from vendor and foundation announcements with differing methodologies and should be treated as directional signals rather than guaranteed outcomes.